Skip to main content
UK inflation and how it compares to the rest of the world

Crumpets or Croissants – what’s in your inflation basket?
The Chancellor, Jeremy Hunt, stated in his recent Budget speech that inflation is expected to fall below the 2% target in just a few months' time, according to figures from the Office for Budget Responsibility (OBR). Whilst politicians are patting themselves on the back for their perceived part in bringing costs down, I’m sure many people are still well aware we continue to live in a cost of living crisis and while inflation is coming down, this simply means that prices are rising at a slower rate, but they are still rising. The speed at which prices have risen on everyday items is hard to comprehend, but it’s not just the UK that is feeling the pain.
But what is really affecting inflation and how is it measured? How does the UK measure up against other economies, how does our basket of goods compare, and most importantly what does this all mean for you and your financial future.
Arrange your free initial consultation
What is inflation?
The release of January’s CPI inflation figures by the Office for National Statistics (ONS) showed that inflation in the UK held steady at 4%, the same rate as in December but below the Bank of England (BoE) and analysts' predictions.
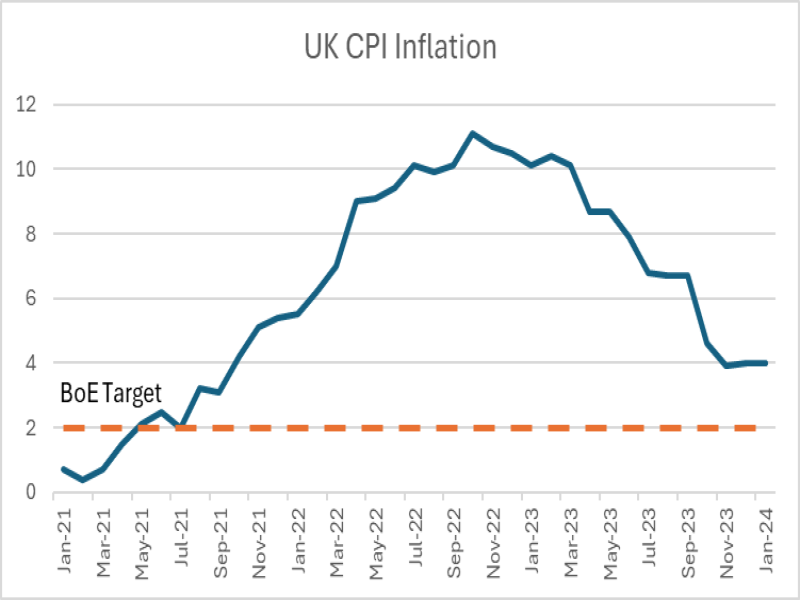
Figure 1 - UK CPI Inflation from January 2021 – January 2024, Source: Office for National Statistics
This marked the 30th consecutive month of inflation being above the 2% target set by the Bank of England, dating back to August 2021. The good news here is that inflation has been steadily falling from the 11.1% high in October 2022, despite the 0.1% rise in December from 3.9% to 4%.
With rising inflation set to continue to impact our lives, it’s worth reminding ourselves about what inflation means and how it is measured. After the last few years, we are all aware of the fact that inflation is the periodic rise in the price of goods and services. But how is this measured to allow the Office for National Statistics (ONS) to come up with a figure each month?
Measuring inflation in the UK
Inflation is measured using price indexes: these do vary in the way they measure prices and what they include but the basics always stay the same. These indexes take a defined basket of goods and services and tracks the changes in the price of each item. Each item's price change is then weighted in relation to the share of total household consumption, to create an average figure that is representative of consumer spending within the economy.
The UK uses three main price indexes, the Retail Price Index (RPI), the Consumer Price Index (CPI) and the Consumer Price Index plus owner-occupiers’ housing costs (CPIH). The main focus is on CPI, a monthly figure calculated by the ONS. This figure does not just hold importance as a way of showing how prices in the UK are changing but is also a measure used by the Government, which links its spending on areas such as state benefits to the figure.
The basket of goods
The basket of goods and services used to measure CPI is made up of over 700 products and is reviewed annually to ensure the measure remains representative of consumer spending. The recent review on March 11 2024, the ONS added 16 items including air fryers, vinyl music, gluten free bread, and edible sunflower seeds. While hand hygiene gel, hot rotisserie cooked chicken, and bakeware were among the 15 items that were removed. With the next review not due until March next year, it will be interesting to see how consumer spending over the next twelve months will affect what items are added and what items are taken away.
Now we have the basket of goods and services, it is the job of local price collectors to visit around 20,000 shops across the country, collecting pricing information. This is done to ensure regional price variations are included in the measure. They visit the same shops and collect information on identical products each month, while the information for larger chain stores is collected using central pricing policies.
The last step in the creation of the CPI figure is to compare the changes in price for each item in the basket, to those collected twelve months ago, to see how the price has changed over the previous year. Each price change is then weighted, taking into account the amount of household spending on the product before being added together to create the final inflation figure for the month.
How is inflation measured around the world?
Inflation is measured in slightly different ways around the world. Price indexes (such as the CPI) are used by different nations. However, the composition, weighting and size of the basket of goods and services varies from country to country to ensure it is representative of the economy which it is measuring inflation for. This provides an insight into how different countries and cultures spend their earnings.
In the UK for example, the basket of goods and services includes Yorkshire puddings, crumpets and fake tan. Items which I am sure may be less popular in France who include fresh scallops, vintage Champagne and butter croissants in their basket of goods and services. The basket used in Italy has over 1,700 items and differentiates between what it defines as “table” and “quality” wine in its calculation.
The United States record the change in price of around 80,000 products each month in their basket of goods, giving them space to include items such as cookies and fresh cupcakes in their inflation measure as well as canned ham.
Finally in New Zealand, the basket also consists of around 700 items taking into account their outdoor lifestyle by including surfboards, fishing rods and women’s jandals, a local term for what we would call flip flops.
How does the UK inflation compare to the rest of the world
Around the world, inflation is continuing to sit above the targets set by many nations' central banks. Figure 2, below, shows the January inflation figures for G20 countries which were released at the time of writing, taking out the anomaly of Turkey and Argentina who reported inflation of 64.9% and 254.2% in January. It may be of some comfort to know that most major economies across the world are sitting in the same camp as the UK. That is with the exception of China who are currently facing deflation, a decline in the prices levels of goods and services, due to a slowdown in their economy.
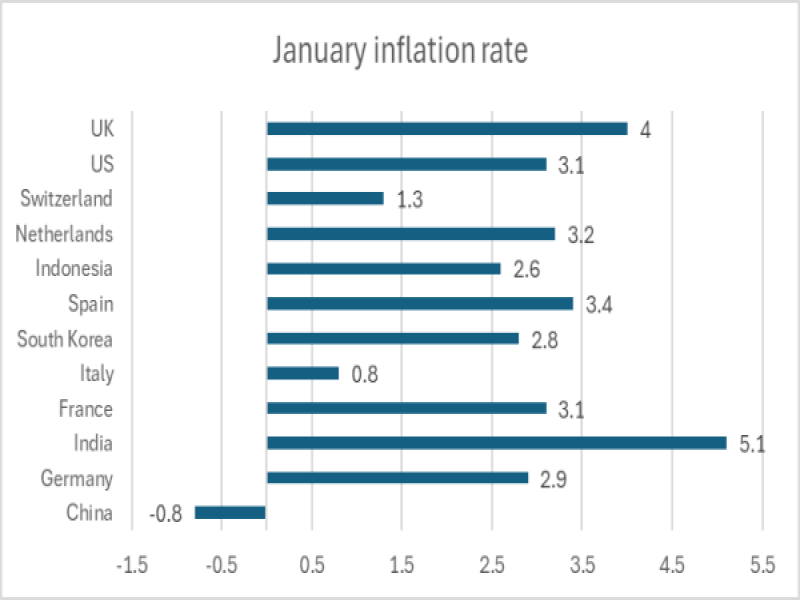
Figure 2 - Euro Area Inflation Rate - January inflation rate 2024, Source: Trading Economics
However, below shows the inflation forecast by the OECD for G7 nations in 2024 and 2025. They are predicting that the UK is set to have the highest inflation out of the G7 nations in both 2024 and 2025. This contradicts the OBR’s expectations, and highlights that the UK could face higher prices for slightly longer than other global economies.
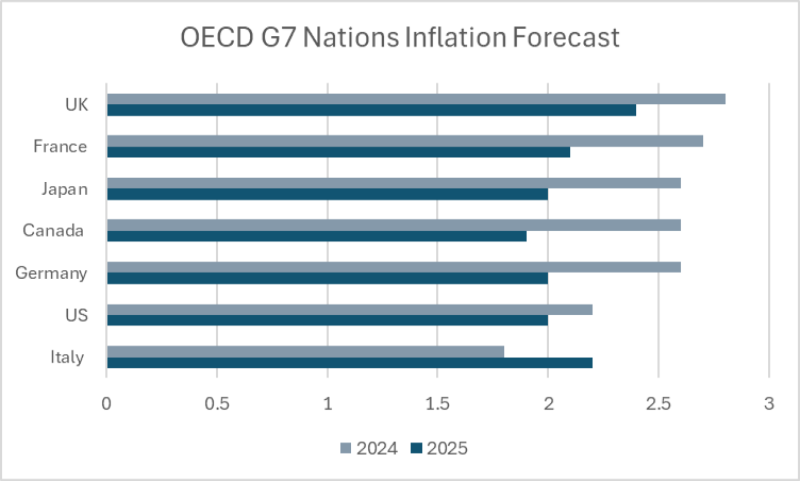
Figure 3 - OECD forecast for inflation level in 2024 and 2025 of the G7 nations, Source: OECD
What this means for your finances and future seems clear at this point, prices will continue to increase, albeit at a slower pace. If we’re to believe the OBR then we may be in for less pain in the coming months. If we’re to believe the OECD then it may take some time to get there, and we may lag behind other G7 nations. If you’d like to discuss how inflation may affect your financial future why not get in touch and speak to one of our experts. We’re offering everyone with £100,000 or more in savings, investments or pensions a free financial review worth £500, so why not get in touch today.
Arrange your free initial consultation
This article is intended for general information only, it does not constitute individual advice and should not be used to inform financial decisions.