 Skip to main content
The Ghost of Markets Past

2022 has been an interesting year with significant market and geopolitical disruption. In many ways, this was the year that the old world returned and the previous paradigm of globalised trade, restrained major power competition, low interest rates, and low inflation was overturned.
Investors have grown accustomed to low inflation, low geopolitical unrest, and low interest rates over the last 40 years. As these presumptions have been disproved and Central Banks have been compelled to respond, financial markets have reacted with volatility.
This volatility has taken the form of negative returns across a variety of asset markets. The most notable of which being both bonds and equities falling together, breaking the traditional hedging relationship between the two assets.
Let us start the story of 2022 with some context, beginning with the post Global Financial Crisis (GFC) world. This was a time of very low inflation and consequently the Central Bank policy of rock-bottom interest rates and Quantitative Easing (QE). As Central Banks pushed down policy interest rates and used their QE programs to flood markets with liquidity, both equities and bonds posted stellar returns with relatively low volatility.
Figure 1. and Figure 2. illustrate this point by showing the returns, volatility and maximum drawdowns of global equities, corporate bonds, and sovereign bonds.
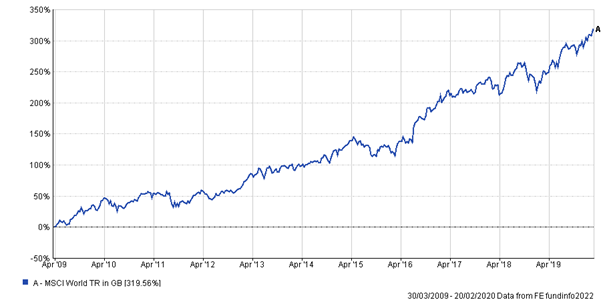
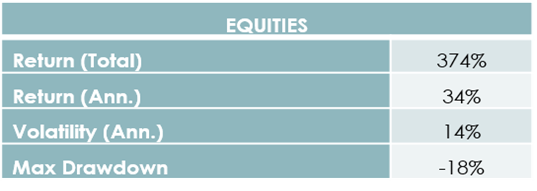
Figure 1. Return of Global Equities between March 2009-February 2020. (Source: FE Analytics – December 2022)
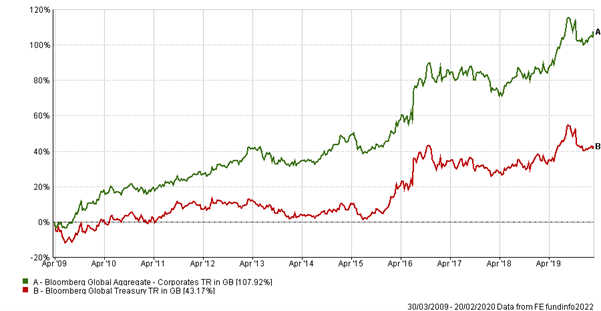
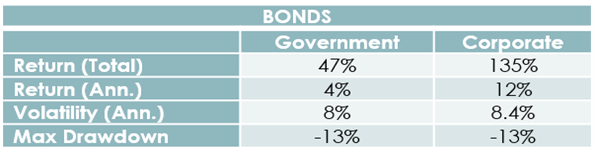
Figure 2. Return of Government and Corporate Bonds between March 2009-Febraury 2020. (Source: FE Analytics – December 2022)
What happened between 2020 and 2022
Unfortunately, good times are invariably followed by bad times! The period between 2020 and 2022 was certainly an example of this.
Never having previously dealt with a global pandemic, monetary and fiscal authorities rushed to stimulate in the hope of avoiding a depression, and in hindsight this was the right choice. However, as inflation emerged in 2021, Central Banks were adamant it was transitory and so there was little need to tighten monetary policy. This choice, in combination with Russia’s war in Ukraine, and the consequent shortages of commodities, laid the foundation for 2022’s red hot inflation (see Figure 3.).
Moving forward we expect to see continued inflationary pressure, albeit at lower levels, but we anticipate headline inflation falling as we move through next year (see Figure 4.)
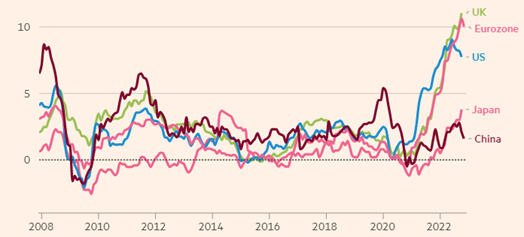
Figure 3. Global Inflation tracker between 2008 and 2022 (Source: FT – December 2022)
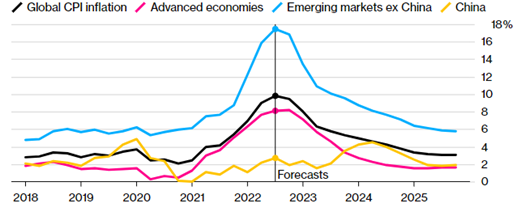
Figure 4. Bloomberg Economist Inflation Forecast(s) from 2018 to 2026 (Source: Bloomberg – December 2022)
The monetary response
As the previous graphs show, inflation has been a global problem. However, the response, or more specifically the timeliness of the response, has not been uniformed, as the following graphic shows (see Figure 5.)
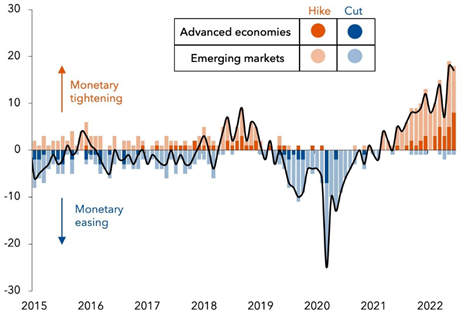
Figure 5. Central Bank Interest Rate Policies between 2015 and 2022 (Source: Peterson Institute for International Economics – December 2022)
The lighter shaded bars show emerging economies, and as can be seen they were far more prudent with their monetary tightening and began this process while developed market central banks were still calling inflation transitory. For example, Brazil increased interest rates early (see Figure 7) and also benefitted over the period from their economies' heavy focus on the commodities that the rest of the world was so short of.
How have Central Banks across the world adjusted their interest rates? The following graphs show the movements of interest rates in Developed (DM) and Emerging markets (EM), respectively (see Figure 6. and Figure 7.)

Figure 6. Developed Market Interest Rates between January 2008 and October 2022 (Source: FE – December 2022)
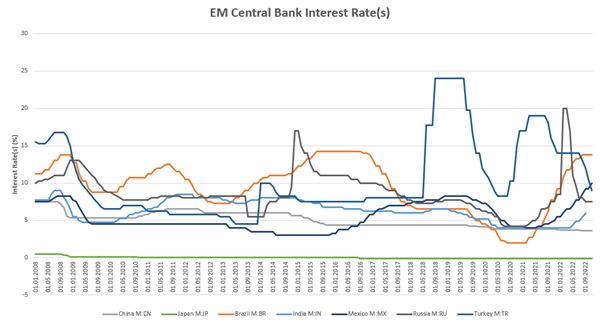
Figure 7. Emerging Market Interest Rates between January 2008 and September 2022 (Source: FE – December 2022)
What are the expectations of interest rates going forward? Figure 4, shows inflation forecasts peaking in emerging and developed markets. As inflation expectations moderate so too have expectations of interest rate rises. Figure 8. shows expectations of future UK interest rates at 3 points in 2022, the first being in January (grey), the second being in September (blue) and the third being in November (red).
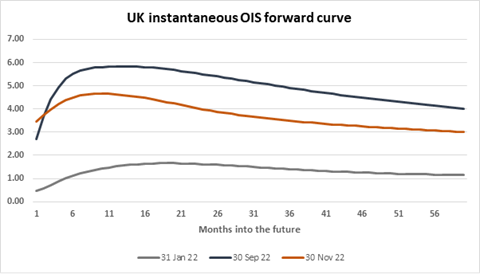
Figure 8. OIS Forward Curve between January 2022 and November 2022 (Source: Bank of England – December 2022)
As we can see interest rate expectations were low at the start of the year as investors believed inflation was indeed transitory, however by September interest rate expectations had shot up in tandem with realised inflation. By November interest rate expectations moderated as it was felt that the peak of inflation came into sight. Bond prices are inverse to their yield, so when investors expect higher interest rates, they tend to lower the price they will pay for bonds now and so push the value of bonds down, causing negative returns for bonds.
How have asset markets reacted to the toxic combination of high inflation and rising interest rates?
We call high inflation and rising interest rates a toxic combination because they tend to leave investors with very few places to hide. Rising inflation puts pressure on bonds as investors expect Central Banks to raise interest rates - consider it from the perspective of a bond holder: if you just bought a bond in 2021 that pays out 2% a year and inflation is now at 7%, you will expect the Central Bank to need to raise interest rates well above 2% to squash the inflation, and so bonds issued in the near future will yield far more than the 2% you currently receive; would you keep holding that bond?
As bond holders sell their bonds, and buyers adjust upwards the yield they demand, overall bond yields are pushed up. This rise in yields is painful for equities, who derive their value from the future cash flows generated by their respective businesses, discounted back to the future. As yields have risen, equity valuations have fallen.
2022 has been a tough year across the board for bonds, whether in developed market sovereign bonds, emerging market sovereign bonds or corporate bonds, as illustrated in figure 9.
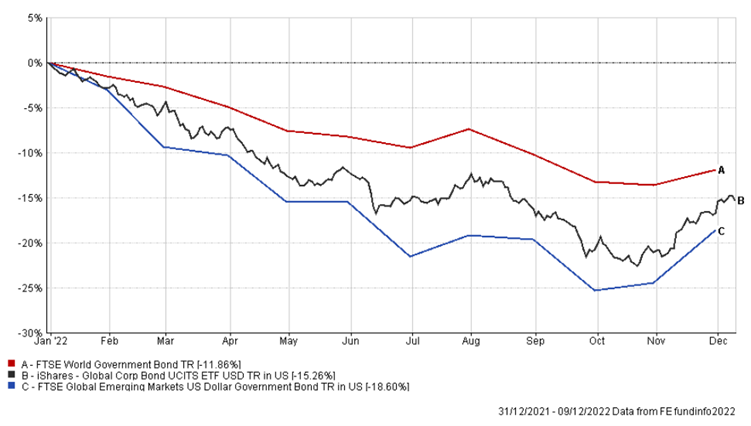
Figure 9. Total Returns of Bond Indices between January 2022 and December 2022 (Source: FE – December 2022)
The pain has also been widespread in equities, with the only beacons of light being those markets with high exposures to commodities and energy.
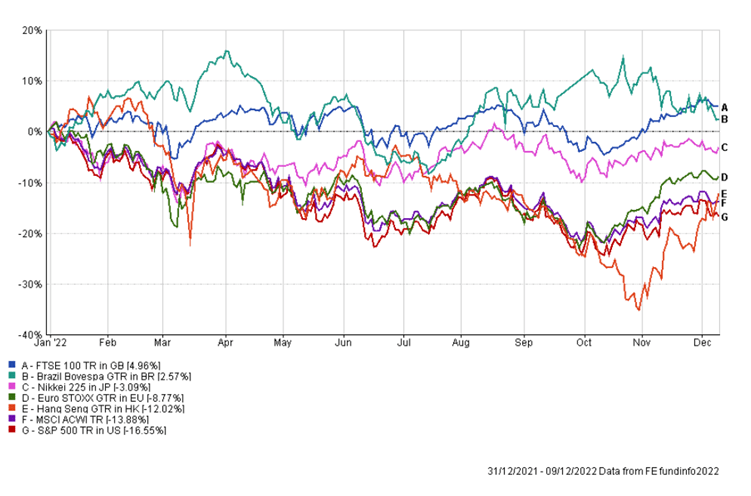
Figure 10. Total Returns of Equity Indices between January 2022 and December 2022 (Source: FE – December 2022)
The graph above shows equity market returns across a wide variety of regions. Most equity markets have fallen significantly, many bottoming at around -20%, with the only two positive returning indices being the UK’s FTSE 100 and Brazil’s Bovespa. Both indices are home to large concentrations of energy and commodity firms, who have seen their profits soar along with the underlying commodity prices of the supply squeezed markets they operate in.
The result of this dynamic of falling bond and equity values has been a positive correlation between bonds and equities.
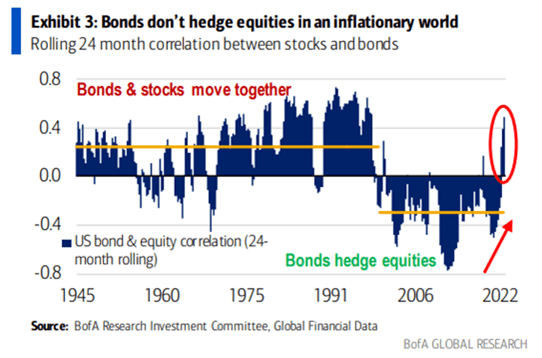
Figure 11. Bond and Equity Correlation between 1945 and 2022 (Source: Bank of America – September 2022)
This dynamic is particularly painful to investors as it removes the hedging tendency of the classic 60/40 portfolio (60% equities and 40% bonds). This is shown in the returns of this type of portfolio through 2022:
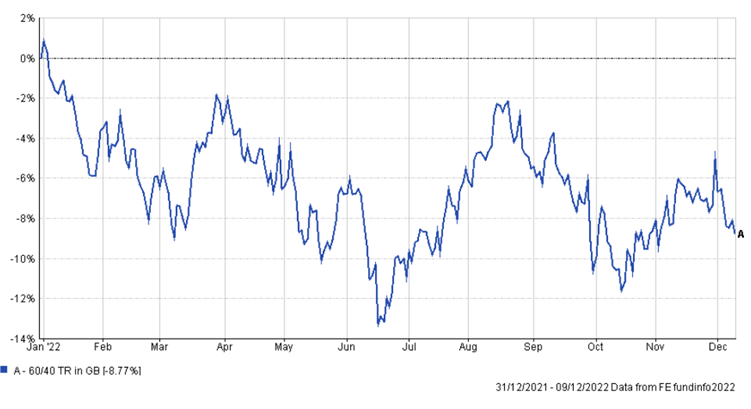
Figure 12. Total Returns of a Representative 60/40 Portfolio between January 2022 and December 2022 (Source: FE – December 2022)
A closer look under the bonnet of the equity market
While at the headline level this has been a very tough year for equities, the pain is not evenly distributed, and there have been some sections of the equity market that have performed relatively well in 2022.
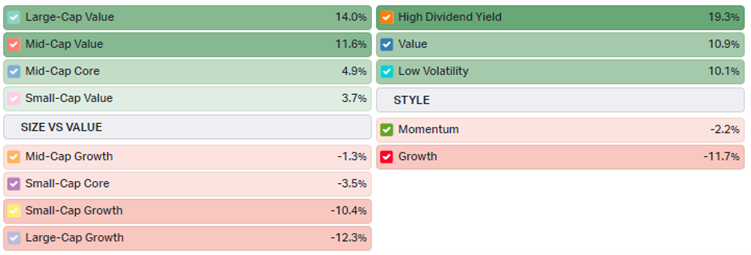
Figure 13. Year-To-Date Equity Factor Returns (Source: Koyfin – December 2022)
When we look at the equity market in terms of factors (these are attributes of companies that can be used to explain returns over time) there is a great deal of variation in returns. Value and high dividend paying firms have outperformed growth firms, while large cap has broadly outperformed small cap. Large cap growth is an exception, but this is due to the big tech names dominating this category, and they entered 2022 significantly overvalued and so saw the greatest falls.
The above pattern of returns is typical in an environment of inflation and rising interest rates. For example the outperformance of Value overgrowth, is a symptom of the discount rate and its impact on the valuation of cash flows – if interest rates are higher, firms that can demonstrate cash flows today do better than firms that derive their value from the hope of spectacular growth in cashflows down the line.
Additionally, the large cap versus small cap performance is explained by pricing power in an inflationary environment. Large firms tend to have more dominant market positions and so are more able to hold costs down with suppliers and pass along costs to customers.
The impact of commodity shortages has influenced the winners and losers in equity market returns by sector:
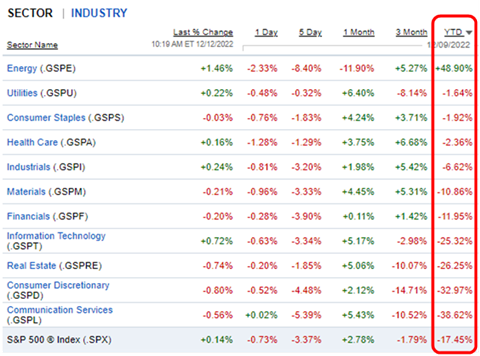
Figure 14. Year-To-Date Equity Sector Returns over the Year to Date (Source: Fidelity – December 2022)
As we can see the real winner has been the energy sector, whereas much of the rest of the equity market has had a torrid year. As mentioned earlier, the big tech names (designated under either Communications Services or Information Technology) have fared the worst and this is why ‘large cap growth’ suffered, despite large cap tending to do better than small cap. Having looked at equity markets, we will move onto the commodity and energy markets to show why commodity and energy producing firms have fared so well.
Energy and commodities
The price of crude oil is incredibly important given the world's dependency on crude oil products. As such, the dramatic rise in oil prices has had a large impact on the global economy, particularly on the upwards momentum of inflation.
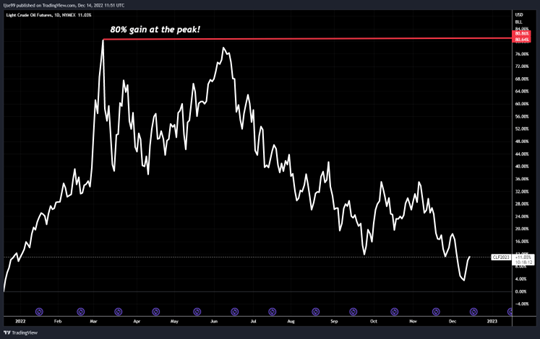
Figure 15. Crude Oil Futures Price between January 2022 and December 2022 (Source: TradingView – December 2022)
The graph above shows crude oil prices through 2022, with the peaking at an 80% gain. However, the extraordinary gains in the energy complex have been elsewhere, as the following graph shows. Here crude oil prices are that small blue line, the orange line is the benchmark European gas price, and the white line is the benchmark coal price.
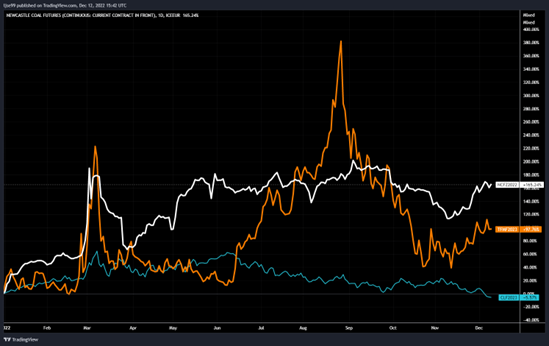
Figure 16. Crude Oil, Natural Gas and Coal Futures Prices between January 2022 and December 2022 (Source: TradingView – December 2022)
As we can see gas prices peaked at a yearly gain of around 380% while coal peaked at a gain of around 200%. The reason for these price gains is the substitutability of energy – if gas prices are high energy producers switch to coal and bid those prices up. In this context, Russian gas supplies to Europe were drastically reduced so European energy consumers turned to global LNG (Liquified Natural Gas) markets and bid those prices up to never-before-seen highs. This in turn pushed Asian gas importers to switch to coal for energy production and in turn bid those prices up to new highs. Producers of these energy sources consequently reaped bountiful profits.
It was not only the energy complex that saw large price increases, as the wider commodity complex also saw a supply squeeze from the Russia-Ukraine war.
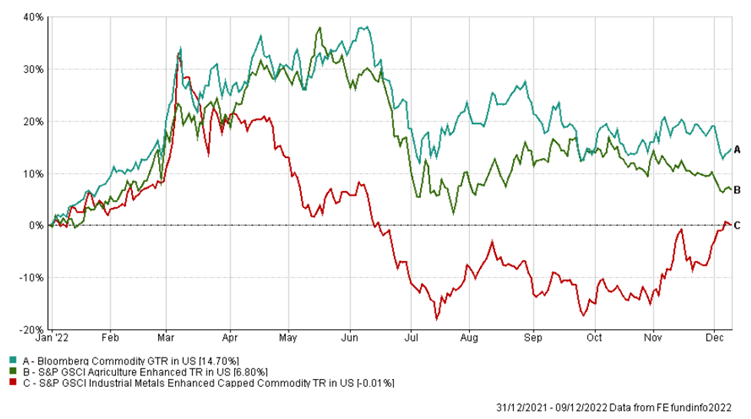
Figure 17. Total Return of Commodity Indices between January 2022 and December 2022 (Source: FE – December 2022)
The chart above shows overall commodities in teal, agricultural commodities in blue and industrial metals in red. While all commodities rose steeply until March, industrial metals fell substantially from then on, while agricultural commodities retained their strength for longer. The demand for industrial metals is highly reactive to economic activity and so slowing expectations of future activity weighed heavily on their prices despite the constrictions in supplies coming from Russian and Ukraine. The demand for food, however, is much stickier, as people always need to eat, so the reductions in supply coming from Russia and Ukraine meant that agricultural commodity prices have remained elevated.
How have currencies reacted to the dynamics of 2022?
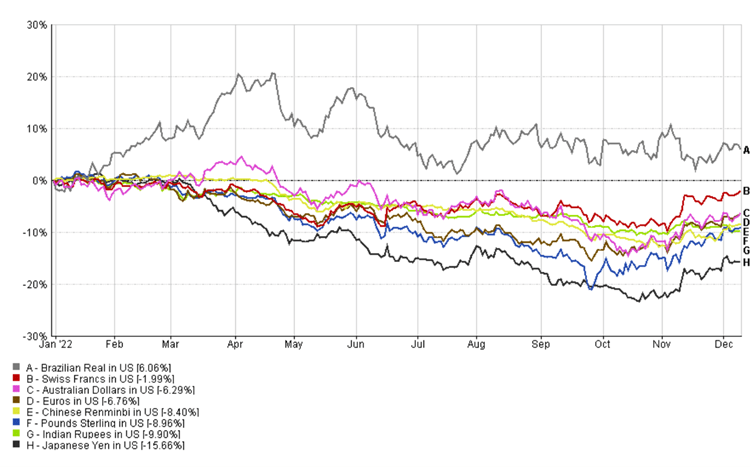
Figure 18. Total Return of Currencies vs USD between January 2022 and December 2022 (Source: FE – December 2022)
The chart above shows major global currencies against the dollar. As we can see, almost all currencies have fallen against the dollar in 2022. This is primarily due to two reasons: the first being the relative intensity of monetary tightening in the US vs other developed economies and the second being the haven role of the dollar.
Under times of elevated uncertainty and financial distress investors move into safe havens to weather out the storm, with the dollar being the primary haven asset. Additionally, the US Federal Reserve raised rates earlier and more forcefully than Central Banks in Europe, Japan, and the UK. As a result US interest rates have been higher than in other developed markets, thus attracting capital in and pushing the value of the dollar up. Brazil’s currency, the Real, has benefited both from the earlier monetary tightening of Brazil’s central bank and from Brazil’s role as a major commodity exporter.
Some reason for hope in 2023 and 2024
While 2022 has been a tough year, this paradoxically gives us increased hope for the coming years. The following table shows the years when declines in the US equity market were greater than 20% and the returns over the following 1, 3, 5 and 10 years.
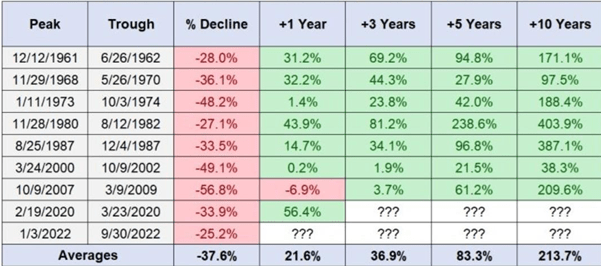
Figure 19. S&P 500 Returns after a greater than 20% drawdown between January 2022 and December 2022 (Source: www.awealthofcommonsense.com)
As we can see, while the declines are uncomfortable, the returns following tend to be substantial, as lower valuations give equities increased room to grow. Equity valuations have so far declined substantially and so we see the years ahead as being good opportunities for returns if investors can stomach the near-term volatility, it is always best to take a longer-term view when investing. If you would like to speak to an adviser about your investments - then get in touch to arrange your free initial consultation.
Arrange a free initial consultation
Note: This Market update is for general information only, does not constitute individual advice and should not be used to inform financial decisions. Additionally, past performance is not a guide to future returns. Investment returns are not guaranteed, and you may get back less than you originally invested.