Skip to main content
Hunt’s politically charged budget
Hunt’s politically charged budget gives the voting public a second National Insurance cut in six months, but will it be enough to save the Tory party in the upcoming General Election?
Chancellor Jeremy Hunt delivered what could be his last Spring Budget (on 6 March 2024), with a further 2% National Insurance cut making the headlines, but there were other measures introduced which could have an impact on your finances. So, what was announced?
Arrange your free initial consultation
National Insurance
Following the 2% National Insurance reduction announced in the Autumn Statement last November, a further 2% National Insurance reduction was announced. This will again affect earnings between £12,570 and £50,270 p.a. and will take effect in April 2024 in the pre-election giveaway that was widely anticipated following speculation in the press. This will save workers up to a further £753 p.a., on top of the up to £753 p.a. saving as a result of the reduction announced in the Autumn Statement.
Child Benefit
It was announced that the High Income Child Benefit Charge (HICBC) will be replaced by a household income based system in April 2026 following a consultation. In the meantime, from April 2024 the threshold above which the HICBC starts to apply on a tapered basis will increase from £50,000 to £60,000 and the top of the taper will increase from £60,000 to £80,000 in a move that Mr Hunt will hope will please working families.
Savings/Investments
Following speculation prior to the Autumn Statement, a British ISA was announced. This will be a further £5,000 tax free ISA allowance for investments into British companies, which will be available in addition to the standard £20,000 ISA allowance.
A new British Savings Bond will also be made available through National Savings and Investments (NS&I), which will offer a fixed rate over three years, though the rate payable has not been announced.
Pensions
Regarding the lifetime allowance, currently 0% and due to be scrapped in April 2024, there were no further changes announced. However, Mr Hunt did not miss the opportunity to reference Labour’s plans to reintroduce the allowance, stating “Ask any Doctor what they think about Labour’s plans to bring it back, and they will say “don’t go back to square one'.”
There were also new rules announced requiring Defined Contribution and Local Government pension funds to disclose how much UK equity exposure they have relative to their international equity exposure. This could prove controversial given the funds’ mandates will be to produce the best risk adjusted return they can for investors, irrespective of their asset allocation.
Property
It was announced that higher rate Capital Gains Tax (CGT) rates on property sales will be reduced from 28% to 24% in April 2024, in a move that the government claims will be revenue generating. The Furnished Holiday Lettings (FHLs) regime will also be abolished.
‘Non-doms’
The current ‘non-dom’ rules, a tax advantageous regime for those who are non-UK domiciled (their ‘permanent home’ is outside the UK), will be replaced by a residency based system from 2025.
Inheritance Tax
After strong rumours that Inheritance Tax would be scrapped before last year’s Autumn Statement, it was not mentioned in the Chancellor’s budget statement.
Conclusion
In what was always going to be a politically charged speech given the proximity to the general election, Chancellor Jeremy Hunt will hope he has done enough to convince voters to give the Conservative Party another term in office in his Spring Budget. In what the Labour Party leader Keir Starmer described as a ‘Last Desperate Act’; the speech was filled with warnings about the potential implications of a future Labour government (the budget speech transcript on the gov.uk website has ‘political content removed’ 27 times!).
However, workers, families, those selling second homes and those already benefitting from last year’s Lifetime Allowance changes may see themselves as in a better position than they were previously, and they could see a future Labour Government as a risk to the longevity of the recently announced changes.
If this is to be the case, there could be a limited opportunity to plan over the next few months. So now is the time to seek advice, to make sure you are doing all you can to protect you and your family’s wealth. If you'd like to learn more about how you can minimise the amount of tax you pay on your wealth, why not get in touch and speak to one of our experts for a free initial consultation or please speak to your adviser if you would like to discuss any of the changes detailed above.
This article is intended for general information only, it does not constitute individual advice and should not be used to inform financial decisions.
The opinions shared in this article are solely those of the individual and they do not necessarily reflect those of The Private Office.
The Financial Conduct Authority (FCA) does not regulate tax advice.
Arrange your free initial consultation

Is the inflation yo-yo and US big-tech distorting investment returns?
As 2024 has started, two key themes have been driving markets. The first is the change in market expectations of the future path of interest rates and the second is the results of the most recent US corporate earnings season. The reason we focus on the US corporate earnings season is the dominance of US markets, which are around 60-70% of the global equity market by market capitalisation.
Arrange your free initial consultation
Interest Rate Expectations
In the fourth quarter of 2023, following a string of monthly inflation data releases that pointed to Central Banks, particularly the US Federal Reserve, imminently achieving their goal of 2% inflation, there was a sharp move in market expectations of interest rate policy. Markets started to expect interest rate cuts to begin in March and continue through the year, culminating in 7 interest rate cuts. Fast forward to the Federal Reserve’s January press conference where Chairman Powell told the press “I don’t think it’s likely that the committee will reach a level of confidence by the time of the March meeting to identify March is the time to [cut interest rates]”. This language had immediate effect – where markets had expected a 62% probability of a March rate cut before the speech, afterwards markets only assigned an 18% probability. This view was further reinforced by the release of labour market data that points to continued strength in employment, along with the release of December’s US inflation data in which inflation ticked up marginally.
In the UK the picture has been a little more complicated, as markets came into the year far more uncertain over the path of inflation and economic growth in the UK. This is important because Bank of England interest rate policy is set based on minimising inflation and maximising growth, so uncertainty over future inflation and growth makes central bank policy less easily predicted by markets.
Taking inflation first, the UK like the rest of the world has benefitted from the reopening of supply chains and falls in commodity prices previously inflated by Russia’s invasion of Ukraine. Domestically though, inflationary pressures remain high, primarily through high wage growth sustained by a mismatch between the type of job vacancies and the skills of available applicants.
With economic growth, the conundrum is between the ‘hard data’, typically collected by governmental agencies and based on activity that has already happened, like economic growth, and the ‘soft data’, typically survey based and forward looking. The Office for National Statistics (ONS) hard data shows the UK entering a mild recession in 2023 along with sharply declining retail sales in December, however the soft data, such as S&P Global’s Purchasing Managers Index point to UK GDP growth moving up % in 2024 (to an annualised rate of 1-1.5%). Taken together, this had made it difficult for investors to predict how the Bank of England will implement policy through 2024. Fortunately for investors, a great deal of certainty has been gained upon the release of January’s inflation data – prices fell -0.6% from December ‘23 to January ’24, taking the annual figure from January ’23 to January ’24 to 4%. It now appears much more likely that the Bank of England will be able to cut interest rates in the near future given that the inflationary threat appears weaker.
Earnings Season
This US earnings season has been a bit of a rollercoaster, starting off weak and rapidly strengthening, leading market sentiment to become increasingly optimistic. Earnings season starts in mid-January with banks and financial firms, who made a poor start and put a negative framing on the season. Following weak earnings releases by cyclical sectors such as energy and basic raw materials these expectations continued. In late January and early February there was a sharp move upwards in aggregate earnings estimates, as the large tech firms (including the so called ‘Magnificent 7’) that comprise 30% of the S&P 500 reported earnings growth far outstripping other sectors. This resulted in an S&P 500 wide earnings growth rate of 2.9%. Conventions over sector can be a little confusing – Amazon and Tesla are classed as Consumer Discretionary businesses, Meta is classed as Communications Services, while Nvidia, Google and Microsoft are in the expected Information Technology sector. This results in the following sectoral earnings growth:
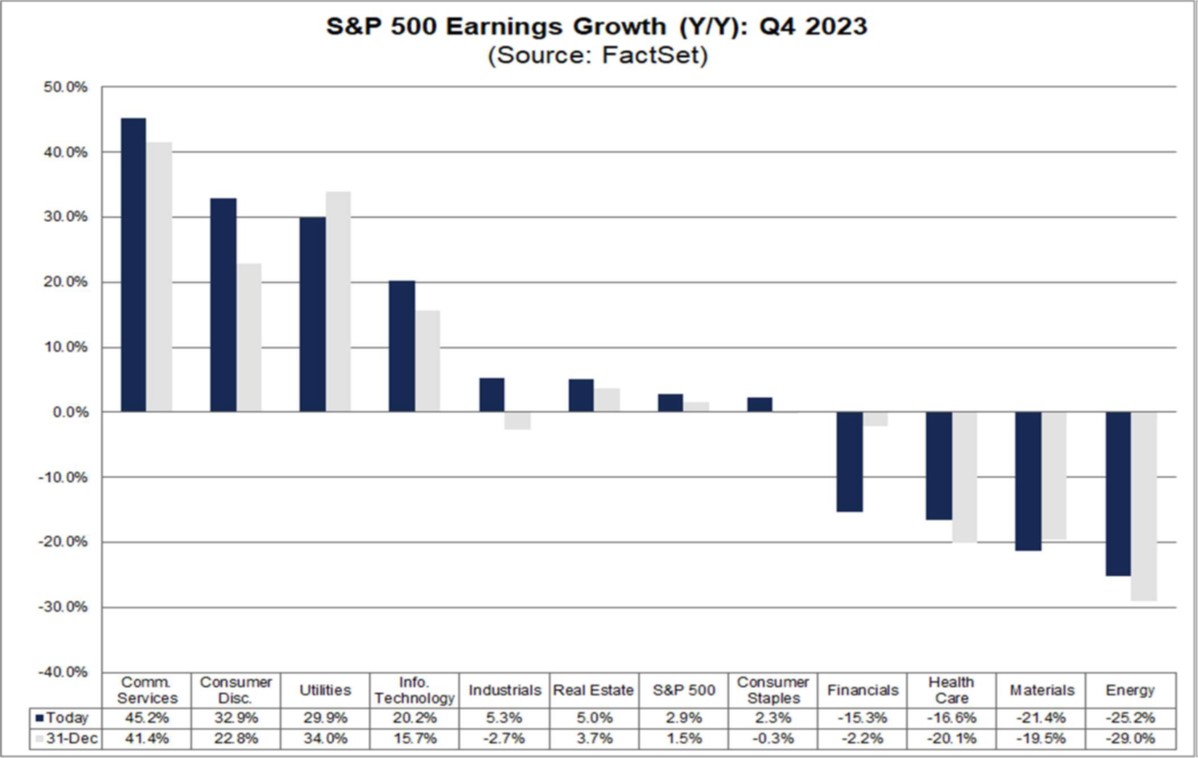
Figure 1 – Sectoral S&P 500 Earnings Growth, Source: FactSet 2024
This will be important when we look at equity market returns by sector.
A quick note on the international picture – European earnings declined at an aggregate level in Q4, US earnings grew 2.9%, while Japanese earnings grew even more rapidly.
Market Reactions
So, how have markets reacted to changes in interest rate expectations and the most recent US corporate earnings season?
Starting with the former, the asset class that had seen the swiftest price gains in November and December was small-cap equities. Small-cap equities have a high sensitivity to interest rate expectations for two reasons, firstly they tend to be more financially fragile and reliant on borrowing at prevailing interest rates, secondly their value often derives from their growth of cashflows far in the future, which is sensitive to interest rates. The result is that small-caps outpaced the wider market as interest rate expectations fell at the end of 2023, but have lagged at the start of this year as interest rate expectations have risen. Government bonds are also sensitive to interest rate expectations, and have seen a similar return profile. Figure 2 below shows the S&P 500 large cap index, MSCI USA Small Cap index and the Bloomberg US Government Bond index over November and December 2023, while the Figure 3 shows those same instruments year-to-date.
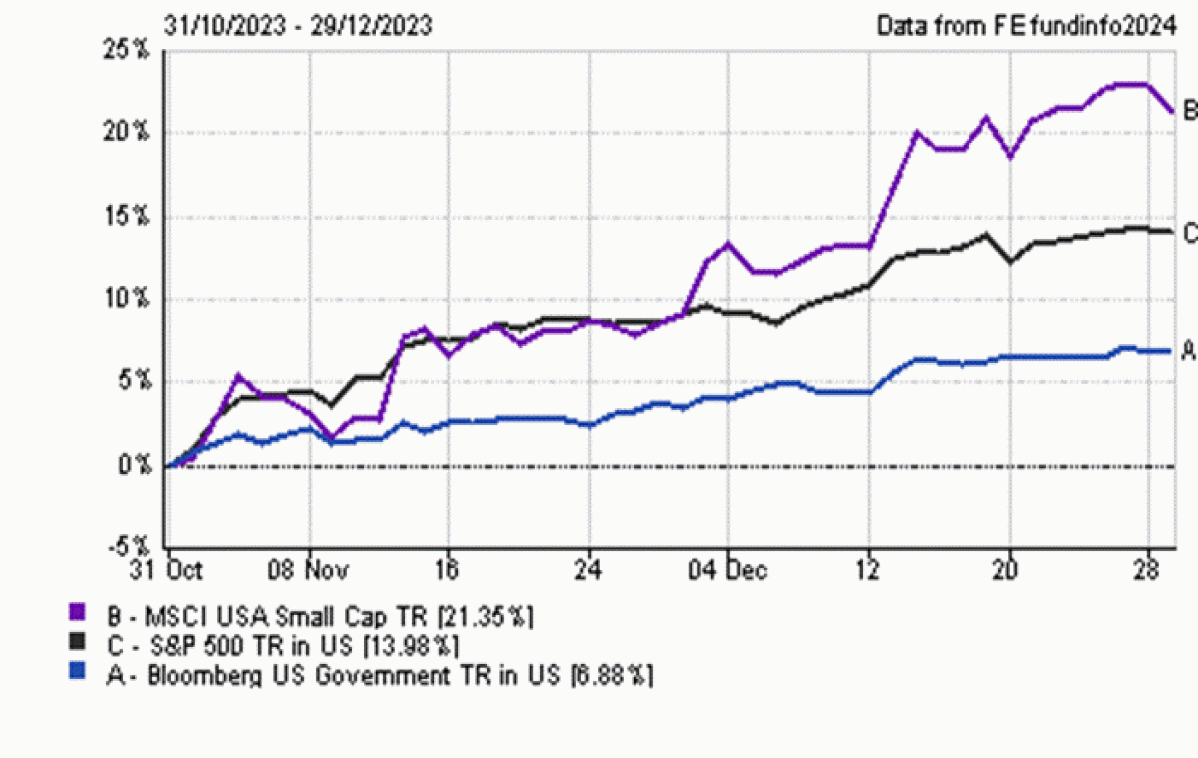 Figure 2 – US Small Cap Equity, US Large Cap Equity & US Treasury Bond returns in November and December 2023, Source: FE Analytics 2024.
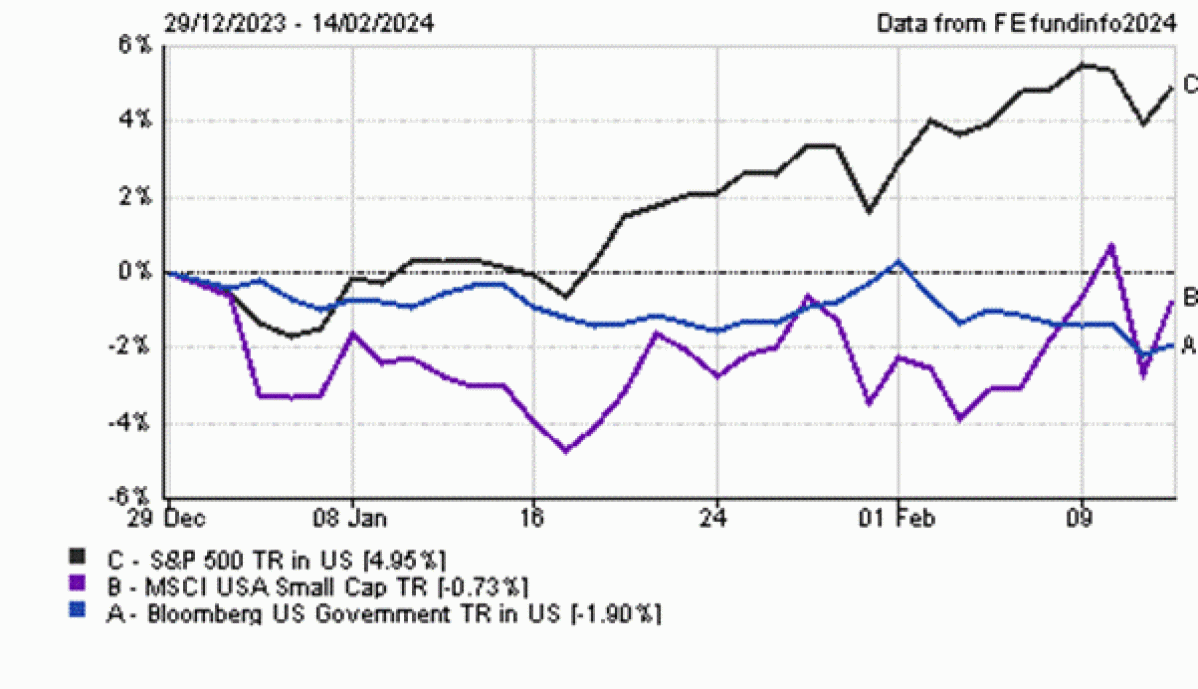 Figure 3 – US Small Cap Equity, US Large Cap Equity & US Treasury Bond returns year-to-date, Source: FE Analytics 2024
Now, moving to the effects of the most recent corporate earnings season. The big-tech sectors were the leaders this earnings season, while the cyclical energy and Materials sectors were the laggards. These results have translated through to equity market returns, and have resulted in the big tech names leading the stock market upwards:
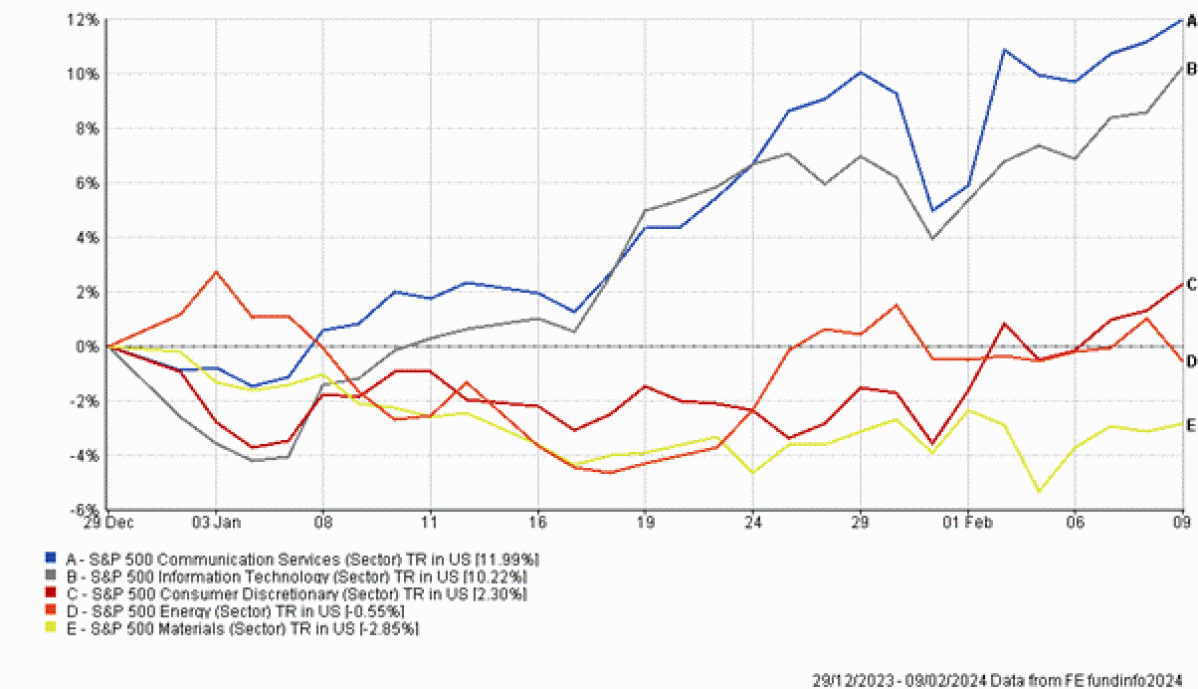 Figure 4 – US Sectoral equity returns year-to-date, Source: FE Analytics 2024.
Similarly, when comparing regional equity markets, Japanese equities have outperformed US equities, which have outperformed European equities. This follows the pattern of regional earnings growth.
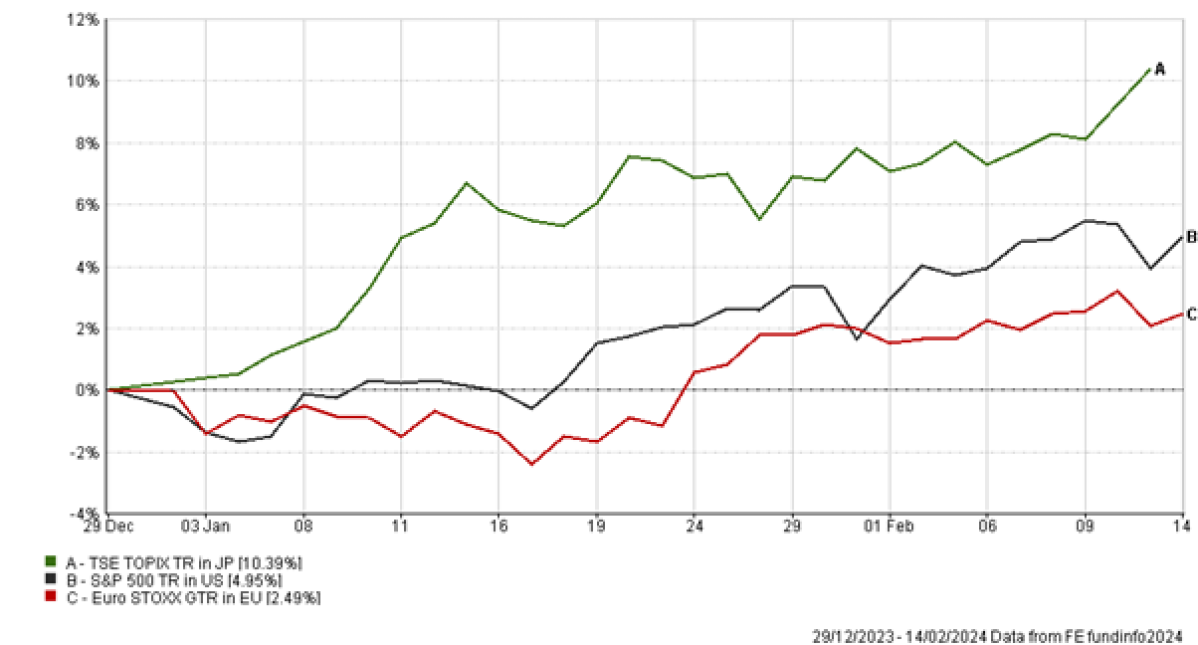 Figure 5 – Regional equity returns, Source: FE Analytics 2024.
Conclusion
In summary, we came into 2024 with expectations of imminent interest rate cuts, which had driven strong performance in interest rate sensitive assets like small-cap equities and government bonds, however the tempering of these expectations has caused a reversal in these returns. Equity markets have broadly followed the pattern of corporate earnings, inter-regionally this has played out through stronger market returns to regions with stronger earnings growth, and intra-regionally has played out through stronger market returns to sectors with stronger earnings growth.
The pattern of returns described above has been beneficial to our discretionary portfolios, which have an agile asset allocation and have been able to skilfully surf the US tech wave by maintaining an overweight position to these winning names. The discretionary nature of these portfolios also means that exposures can be rapidly changed if the investment thesis changes. Although the asset allocation of our advisory services is, by design, not as nimble, we have positioned them to take advantage of the structural themes that have played out in this most recent corporate earnings season, by adding a structural overweight position to Japanese equities, where we have identified the potential for long-term earnings growth outperformance.
If you would like to speak to your adviser about this, or have any other questions please don’t hesitate to get in touch.
Arrange your free initial consultation
This market update is for general information only, does not constitute individual advice and should not be used to inform financial decisions.
Past performance is not a guide to future returns. Investment returns are not guaranteed, and you may get back less than you originally invested.

The importance of Cash
There’s no getting away from it, costs have risen exponentially. With a growing cost of living crisis throughout the country, the need for cash retention to act as a buffer in these circumstances remains vital for everyone. This increase in costs will likely mean most people will need to try and save money where they can. Nevertheless, while cash is a crucial component of a well-rounded financial strategy, it's essential to strike a balance. Allocating too much cash for an extended period could expose your wealth to inflation risk, where the purchasing power of your money will decrease over time. It is therefore imperative to assess your overall financial goals, time horizon and risk appetite when deciding how much to keep in cash versus how much to invest in other assets.
There are many reasons to hold money in cash, so we look to explore the importance of cash and its inherent benefits within personal finance, whilst also considering the common risks associated with cash investments. Of course, managing your savings is a highly personalised process, and how much you save should reflect your individual circumstances.
Arrange your free initial consultation
Emergency Fund
The term ‘emergency fund’ or ‘buffer’ refers to money set aside for the sole purpose of being used in times of financial distress. The fund provides a financial safety net to cover any unexpected, and typically costly, expenses that may arise such as those following a loss of job or unexpected tax bill. The amount you should target for an emergency fund depends on a number of factors, including your financial situation, expenses, lifestyle, and debts. Typically, consideration may be given between three to six months of normal expenditure in cash, to be drawn from in the event of an emergency. This is considered a prudent financial practice because it helps avoid unnecessary debt and financial stress.
Top Tip: Starting off small is better than not starting at all!
The Stock Market
While investing in the stock market offers great potential opportunities for accumulating wealth and financial growth, it is important to be aware of the fundamental downsides and risks, and striking the right balance between investments and cash has proven particularly relevant over the past few years with investment markets going through a turbulent time.
Although investors are attracted to the idea of growing their wealth through stock market investments, this should always be looked at as a long-term strategy given the risks associated.
Up until November 2021, there were very few options for your lower risk portion of your wealth, as interest rates were extremely low. However, since the recent interest rate hikes many investors are turning their attention towards setting aside some cash into savings account and are benefiting from some of the highest returns in almost two decades. Unsurprisingly, the last few years have witnessed huge inflows of cash into savings, particularly fixed time deposits, with investors looking elsewhere from the stock market in providing safer and guaranteed returns.
Nonetheless, whilst saving rates have risen, cash has been a depreciating asset, after inflation, with ‘real returns’, remaining negative over the long term. So, for many, it is fundamental to have a comprehensive financial plan in place, to ensure your investment and cash allocations are aligned to meet your objectives and goals.
When it comes to investing, however, one particular benefit of holding some money in cash is managing sequencing risk with your investments. This refers to the impact of the timing of investment returns on a portfolio, particularly when withdrawals are made. If an investor needs to sell assets to cover income or emergency expenses, this can significantly affect the overall portfolio value. As such, the benefit of holding some money in cash is that you help reduce the chances of becoming a forced seller during an investment market downturn. By having this safety measure in place, you can help cover some expected or unexpected expenditure without negatively impacting your long-term investment strategy.
If you are interested in exploring what savings accounts have to offer, please check out our best buy tables, which compares the best accounts on the market.
Retirement
Holding cash as you approach retirement plays a vital role in providing financial flexibility, security and peace of mind when we consider aforementioned risks with invested pension provisions.
As we have covered, sequencing risk can be a major issue for investors. This risk is more common during retirement, as you are far more dependent on your retirement income through your invested pension pots. Significant market downturns alongside taking pension income could be detrimental on your long-term retirement goals, where cash reserves are not in place, as you could be realising losses that could impact the value of your future pension provisions.
Furthermore, healthcare costs are increasingly forming a large part of unexpected costs during retirement. Health spending per person steeply increases after the age of 50, so having cash buffers in place to cover immediate healthcare needs is important.
Using cash in place of drawing from your pension can also have tax benefits, as some pensions sit outside the scope of inheritance tax. This means that the assets held within a pension fund may not be subject to inheritance tax when passed on to beneficiaries. However, given the complexity of inheritance tax laws, it is recommended to seek advice from professionals who have the expertise to guide you through your estate and pension planning.
If you’d like to learn more about how cash can best play a part in your wealth strategy, why not get in touch and speak to one of our experts.
Arrange your free initial consultation
This article is intended for general information only, it does not constitute individual advice and should not be used to inform financial decisions.
Investment returns are not guaranteed, and you may get back less than you originally invested. Past performance is not a guide to future returns.
The Financial Conduct Authority (FCA) does not regulate cash flow planning, estate planning or tax advice.
Savings Champion and their associated services are not regulated by the Financial Conduct Authority (FCA).
The value of professional advice isn't just financial
In an era of instant information and digital connectivity, obtaining financial advice has become more accessible than ever. However, it's important to consider the reliability of your sources, particularly on the internet and from individuals lacking the necessary qualifications and expertise to provide advice. Research by the Financial Service Compensation Scheme (FSCS) revealed that 22% of individuals seek advice from friends, family, or colleagues, 31% turn to online forums or tools, and 9% rely on advice from Social Media Influencers.
Arrange your free initial consultation
While the internet offers a plethora of sources for managing finances, the crucial question remains: is it trustworthy? The easy spread of information on social media and the internet has created a risky environment with unregulated content directing financial decisions. Without regulatory oversight, misleading or inaccurate advice can quickly circulate, posing a potential threat to unsuspecting investors.
Additionally, while seeking advice from close relationships can create a comfortable space for discussing financial matters, it's key to exercise caution. The existing trust and comfort within such relationships may foster a sense of security, but it's equally important to evaluate the individual's expertise. Just as you wouldn't turn to your electrician for medical advice, the same principle should apply to decisions impacting your financial well-being.
The FSCS study further delved into the reasons individuals hesitated to enlist the services of a regulated financial advisor, revealing intriguing insight. Specifically, 23% believed the value of their savings and investments fell short of the amount needed, and 38% expressed concerns about associated costs and value for money. These findings highlight a significant gap in understanding regarding the financial and emotional benefits derived from seeking professional financial advice, contributing to the emergence of the Advice Gap.
The Advice Gap
In the United Kingdom, the Advice Gap refers to a staggering 39 million adults who currently abstain from seeking any form of professional financial advice. Research conducted by the Financial Conduct Authority (FCA) in 2022 sheds light on this issue, revealing that a 60% of individuals with £10,000 or more of investable assets do not consider financial advice, due to the perception that they wouldn't benefit from it. Further insights from the FSCS investigation, revealed interesting thresholds for considering financial advice worthwhile. 13% of respondents believed that a minimum of £100,000 in funds was necessary, while 21% admitted they were uncertain about the financial threshold. This reveals a substantial segment of the population, hesitant to seek advice due to uncertainty about the potential benefits awaiting them.
The real value of Professional Guidance
A study conducted in 2019 by the International Longevity Centre (ILC) in the UK, illuminates the financial impact of seeking professional advice. The research uncovered that those individuals who sought financial guidance during the period from 2001 to 2006, experienced a total wealth boost of £47,706 in their assets over the following decade, compared to those who navigated the financial landscape independently. While the estimated average cost of a one-off independent financial consultation may be approximately £2,000, the benefits accrued over a 10-year period exceed this cost by an impressive 24 times, resulting in a net gain of £4,570 per year. This emphasises that investment in financial advice is essentially an investment in securing a more resilient and prosperous financial future.
The study goes beyond highlighting the importance of a single consultation; it emphasises the significant impact of continuous advice. Individuals who sought financial guidance more than once over the decade, experienced a remarkable 61% improvement in overall financial well-being compared to those who sought advice only once. Achieving financial well-being is not a destination, but a journey. It involves adapting to changing circumstances, making informed decisions, and staying proactive in financial planning. The study's findings highlight the importance of having a trusted advisor who can provide ongoing support, helping individuals navigate the complexities of the financial landscape.
The FSCS study brought to light a common scepticism regarding the minimum asset requirement for benefiting from financial advice. Contrary to the notion that financial advice primarily caters to those with high net worth, the ILC study, mentioned above, demonstrated that individuals who consider themselves in the "just getting by" category experienced a more substantial financial enhancement compared to their wealthier counterparts. For instance, while the affluent group saw an 11% increase in pension wealth, the "just getting by" group experienced an impressive 24% boost in pension income. The key takeaway is quite evident; irrespective of your income level, seeking financial advice can indeed exert a meaningful influence on your financial well-being.
Emotional value of advice
In reference to the ILC study, a whopping 88% of people who have taken advice think it’s good value for money. However, the worth of advice extends beyond financial gains. Amidst the backdrop of market volatility and continuing uncertainty in the political and economic spheres over the past year, it’s good to see that the emotional benefits of advice plays an important role.
A study conducted by Royal London delves into the emotional well-being advantages of seeking advice, revealing that it can offer more than just financial perks. The top three cited benefits include:
- Enhanced confidence in financial plans and the future.
- Heightened control over one's finances.
- Peace of mind and sense of preparedness to navigate life's unforeseen challenges.
Moreover, individuals reported being less anxious about their financial preparedness for retirement, highlighting the emotional impact that sound advice can have at various stages of life.
In conclusion, the studies provided by the FSCS, FCA, ILC and Royal London, paint a compelling picture of the misconceptions around financial advice and the hidden value both for financial and emotional well-being in seeking professional guidance. If you've found yourself questioning the relevance of financial advice in your life, this body of research strongly indicates that taking professional guidance could be a crucial step toward unlocking a more prosperous financial future. So don’t just take our word for it, the research speaks for itself.
If you’d like to learn more about how we can help you achieve the financial future you want, why not get in touch and speak to one our qualified financial advisors for a free initial consultation.
And why not have a look on independent website VouchedFor, to see what our existing clients have to say about us.
Arrange your free initial consultation
This article is intended for general information only, it does not constitute individual advice and should not be used to inform financial decisions.
Investment returns are not guaranteed, and you may get back less than you originally invested. Past performance is not a guide to future returns.
The Financial Conduct Authority (FCA) does not regulate cash flow planning or tax advice.

Stealth tax raid on your wealth
Although many could be forgiven for believing the tax year 23/24 has been a fairly quiet year from a tax perspective, the simple act of freezing tax brackets and freezing or reducing allowances means these are likely to be the biggest tax raising measures since the 1970s. This statement continues to ring true even after taking into account the announcements made in the Autumn Statement back in November. As we now move closer to the Budget, due on the 6th March, with the current government looking at all options to keep them in power in an election year, one thing is for sure, we’re all feeling the effects of stealth taxes. So, will this change?
Arrange your free initial consultation
Stealth tax refers to government policies that increase tax revenue without directly or explicitly labelling them as tax hikes. These taxes often take the form of adjustments to existing taxes and allowances, fees, or other government charges, rather than the introduction of new higher taxes.
The term stealth taxes implies that these changes are designed to be less noticeable to the general public. Bluntly, the Government may look to introduce these less obvious changes, or indeed make no changes at all, so as to avoid criticism, potentially relying on blind siding taxpayers.
However, some would argue that such measures can be necessary for funding government programs and services or indeed paying back the mountain of debt the UK is now faced with, while avoiding public backlash. One thing is certain however, there are currently many different types of stealth taxes, which means few people are immune from paying much more tax now and potentially in the coming years. Even those not normally concerned are starting to sit up and notice; with the impact of fiscal drag on their finances, it’s hard not to feel the pinch.
Latest figures from HM Revenue and Customs (HMRC) show that total tax receipts for April 2023 to November 2023 are £515.9 billion, which is £24.0 billion higher than the same period last year.
In ‘normal’ times the Government has typically pursued a policy to increase tax allowances with the rate of inflation. However back in in 2021 the Government announced plans to freeze allowances and thresholds until 2026. This was later extended to 2028. A clever and rewarding move by the Government. The impact of this is staggering and continues to grow, for example, according to the BBC, simply freezing Income Tax bands until 2028 will create an additional 3.2 million new taxpayers and mean 2.6 million more people will pay higher rate tax. In fact, the Institute for Fiscal studies has stated that by 2027/28 one in eight nurses and one in four teachers will pay higher rate tax.
Even pensioners aren’t immune. According to HMRC an additional 800,000 pensioners will be paying income tax this year due to higher inflation pushing up state pension, which will take many of them over the frozen personal allowance.
Added to this, in the spring Budget early in 2023, the Chancellor announced a reduction in the amount you could earn before paying additional rate tax at 45%. Previously you would have breached the additional rate tax band once your earnings exceeded £150,000 per year, however, from April 2023 it was cut to £125,000, dragging many more people into the additional rate tax net.
Impacts of the Autumn Statement 2023
Following the Autumn Statement delivered by the Chancellor, Jeremy Hunt, in November last year, it should be noted that despite some changes designed to give the public back some money in their pocket, by reducing National Insurance payments, stealth taxes continue to be ever present. My colleague Alex Shields wrote a great article summarising the changes outlined in the Autumn Statement.
The first area of note is the changes to National Insurance (NI) payments - as a result of higher inflation, higher interest rates and frozen tax bands, the Office for Budget Responsibility (OBR) states “Living standards, as measured by real household disposable income per person, are forecast to be 3.5 per cent lower in 2024-25 than their pre-pandemic level.” With this in mind even the 2% reduction for employee NI contributions only results in a £754 p.a. for anyone earning over £50,270, which is a relatively small amount given the increasing day to day costs driven by inflation over the last 12-18 months.
What Stealth Taxes are the biggest earners?
Income Tax Freeze
The stealth tax which is arguably the most prominent and takes in the largest receipts are the income tax bands, which are frozen until 2028. Given that on average UK wages increase year on year, and even more so while inflation rocketed, individuals have been moving up the income tax bands, potentially without realising, just by receiving routine pay increases each year. Some 5.59 million people in the UK currently pay higher rate tax, official HMRC figures show, with an additional 310,000 dragged into it in the year 2022 alone. Over the last few years inflation and interest rates have been in a constant battle in order to try and bring inflation back to its 2% target, while wage inflation had been steadily increasing in the background. Although inflation had been falling in recent months, this month saw a surprise small uptick from 3.90% to 4%, meaning it’s stickier than expected and certainly well above the target 2%, so it’s little wonder that demand from the UK labour force for higher wages continues to increase. This, in tandem, drives up the impact of this particular stealth tax – as wages increase over the frozen income tax bands.
Furthermore, as mentioned above, pensioners received a boost as the Government remained committed to the State Pension triple lock; it was announced in the Autumn Statement 2023 that the full State Pension will be increasing to £11,501 per annum from April 2024. But, this in turn leads to many pensioners having to pay more tax than the year before given the freeze on income tax bands. In fact, those on low pension incomes are in risk of paying tax for the first time as they breach the personal allowance of £12,570. This could squeeze the finances of those pensioners on lower incomes more than they were previously, while also pushing others into a higher tax bracket – pointing to the benefit of ongoing financial planning.
Latest costings of personal tax threshold measures
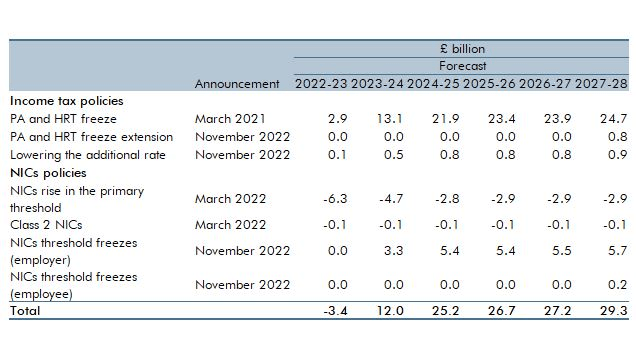
Source: Office for Budget Responsibility
Savings Allowance Freeze
Another potential stealth tax to be aware of is the tax on savings interest. A basic rate taxpayer can earn up to £1,000 interest outside an ISA without facing a tax bill. This is known as your Personal Savings Allowance (PSA). The allowance is £500 for those paying higher rate tax, and additional rate taxpayers have no allowance at all. Due to very low interest rates in previous years, this tax allowance has been all but forgotten about, with the majority of savers accumulating savings interest tax free.
However, given the Bank of England base rate rose 14 times consecutively from December 2021 in an attempt to combat inflation, cash savings rates became much more attractive as a result (see Savings Champion best buys). Many savers will now accrue significant taxable interest, which in turn takes them over their Personal Savings Allowance and they will therefore need to pay tax.
To put this into context, back in December 2021 a saver could deposit over £133,000 in a best buy account before breaching the basic rate taxpayers PSA. Fast forward to October 2023, when interest rates were peaking, if you saved in the top easy access account, you would breach the PSA on a balance of just over £19,000.
In fact, it’s been reported that the number of people paying tax on their savings income in the 2022/23 tax year has almost doubled to 1.77 million compared to the 0.97 million people the year before. And the amount collected has more than doubled from £1.2 billion to £3.4 billion.
Inheritance Tax
In a similar light to the Income Tax freeze, the Inheritance Tax (IHT) nil rate band (NRB) and residence NRB have also been frozen until 2028. Worst still, however, the current NRB hasn’t changed since 2009, so has remained the same for 14 years. As it stands for the current tax year 2023/24, you will have to pay Inheritance Tax if the value of your estate exceeds £325,000. Anything below this threshold is tax free. Anything above this threshold would be charged at 40%. Those who are passing down their main home to direct descendants are also entitled to an additional allowance of £175,000, known as the residence nil rate band (RNRB), however this allowance actually starts to be withdrawn where the value of the estate exceeds the £2 million taper threshold.
Due to the rising rate of inflation coupled with increasing property values across the UK, the freeze essentially means that a greater number of people will cross the inheritance tax threshold each year, as the value of their total assets have increased, whilst the allowance has remained the same. In the 22/23 tax year a record £7.1 billion in IHT receipts was raised, which was up £1 billion from the previous tax year. With freezing this allowance and estates growing, IHT receipts are expected to increase consistently. In fact, figures from HM Revenue & Customs (HMRC) show a record breaking £2.6bn of inheritance tax receipts were collected in just the 13 weeks between April and July 2023.
The latest figures from HMRC show Inheritance Tax receipts for April 2023 to November 2023 were £5.2 billion, which is £0.4 billion higher than the same period last year.
Why should there be more awareness of these stealth taxes?
Given the current economic climate, it’s wise to ensure your hard-earned money, whether that’s income, investments or savings, are working for you in the most tax efficient way possible. These stealth taxes, if left unattended, will drag on your accumulated and accumulating wealth. The good news is, there are simple ways of mitigating the impact of stealth taxes by being aware of and using the allowances available to you (but be conscious not to creep over them). Moreover, ensuring you are investing, saving, and contributing to tax efficient savings and investments with tax free wrappers will also help to mitigate some of these stealth taxes.
A few examples include:
Use your ISA Allowance
- Saving money into an ISA (the most common being Stocks and Shares or Cash); everyone gets a £20,000 per tax year allowance and any growth within an ISA is totally tax free.
Fund your pension
- If you find yourself entering a new tax bracket, whether that is higher or additional rate, by funding a pension you will receive tax relief at your marginal rate, so are effectively given a tax boost by contributing. For example, a basic rate taxpayer would receive tax relief at 20%, a higher rate by 40% and additional rate by 45%.
- Added to the fact, by contributing to a pension you could even reduce your income as the money is taken at source, so therefore you could change the income tax bracket you fall into.
Watch out for the 60% tax trap
If you earn over £100,000 you begin to lose your personal allowance and could find yourself effectively paying 60% income tax as you lose it – this makes pension funding in this bracket especially attractive.
High Income Child Benefit tax charge
- For parents claiming child benefit, if you or your partner have an income of more than £50,000 a tax charge applies. One way you may avoid the tax charge is if a personal pension contribution is made. If the contribution is enough to reduce your income below £50,000, the High Income Child Benefit tax charge will be avoided.
Use allowances before they are cut
- From 6th April 2024 both the Capital Gains Tax and Dividend Allowance are being halved, £6,000 to £3,000 and £1,000 to £500 respectively.
Whatever side you’re on, working through the political landscape right now can be hard. Therefore, having regular financial planning sessions with a professional independent financial adviser could help mitigate against many of the stealth taxes, so why not get in touch and see how we can help you.
Arrange your free initial consultation
This article is intended for general information only, it does not constitute individual advice and should not be used to inform financial decisions.
This article is also based upon our understanding of current law, HM Revenue and Custom's practice, tax rates and exemptions which are subject to change.
Savings Champion and their associated services are not regulated by the Financial Conduct Authority (FCA).
The Financial Conduct Authority (FCA) does not regulate cash flow planning, estate planning, tax or trust advice.

A great end to 2023 but will there be a New Year hangover?
This month we take a look at some of the big factors we believe will influence the markets in 2024.
Inflation is falling towards the 2% target, but the risk remains to this aspirational target. In particular, the labour market will need to weaken further, and supply chain disruptions - such as the Red Sea 'crisis', could cause a flare up.
Interest rates are likely to be cut, although markets have been a bit too ambitious with their expectations.
Corporate earnings expectations are too high. Earnings are likely to grow, but it is more likely to be mid-single digits rather than low double digits growth.
Stocks in the US are expensive at an aggregate level, however there is a large divergence between the most and least expensive stocks. Equally, there are large gaps between how expensive the stocks of regional equity markets and sectors are. These differences in valuation could be a source of additional returns to skilled investment managers.
Economic growth will slow down in the US as excess savings - accumulated during Covid times and beyond - are spent. European and UK growth may be buoyed by remaining excess savings. Therefore, growth prospects are likely to converge.
Geopolitics will continue to be a large - and growing - factor. If the world continues to split into factions or spheres of influence then this is likely to increase costs for businesses, which creates an upside risk to inflation.
Arrange a free initial consultation
Inflation outlook remains uncertain despite recent falls
Inflation has declined notably in major economies such as the US and UK over recent months, largely driven by falling goods prices. For example, in the US, goods inflation is near zero whilst services inflation remains sticky around 5%. Chinese export prices have been falling, lowering input costs for companies globally and pulling down inflationary pressures on consumer goods – this has had a large impact and is likely to continue as Chinese industrial production continues to grow rapidly. However, risks remain that inflation may persist. The labour market will need to further weaken to bring down wage growth from around 4%, reducing consumer spending power. Supply chain disruptions also pose an upside risk if shortages re-emerge or shipping lanes are further disrupted, increasing costs.
Currently, US pay growth remains around 4%, enabling higher consumer spending that can drive further price increases. As wages and prices rise in tandem, it creates a self-reinforcing inflationary cycle. Resolving this dynamic requires labour market weakness to lower wage growth momentum. We have seen progress in reducing wage growth, as higher wages have pulled workers into the labour force, increasing the participation ratio, however wage growth of around 3% is more consistent with inflation at the central bank target of 2%, according to JP Morgan.
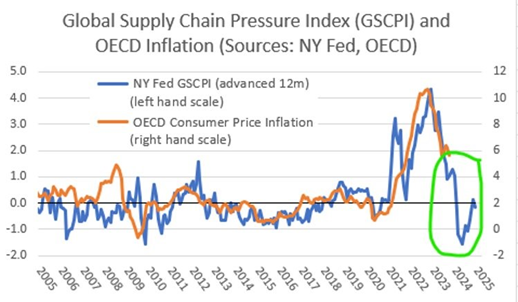
Figure 1: OECD Inflation & NY Fed Global Supply Chain Pressure Index, Source: NY Fed, OECD, 2023.
Additionally, supply chain pressures appear to be re-intensifying based on the New York Federal Reserve’s Global Supply Chain Pressure Index, pictured above. As shortages re-emerge and shipping lanes are disrupted, companies may again raise prices to preserve margins. Deglobalisation and onshoring production could also add to costs and inflationary pressures as supply chains shorten but become less efficient. The outlook remains uncertain; in the short term it looks like inflation will continue to fall but there is no room for complacency and wage-based inflation is harder to derail.
Moderating US corporate earnings growth likely as the economy slows
With inflation declining, earnings growth is also likely to moderate from current expectations of double-digit growth in 2024. Profit margins remain near cyclical highs in many regions, including the US, Europe, and UK. As revenue growth slows in a disinflationary environment, profit margins may come under pressure. Falling headline inflation can reduce corporates' input and financing costs, but the disinflation-induced drag on nominal economic growth tends to depress corporate revenues. In such a scenario, the fall in input costs may not keep up with the fall in revenues, thus eroding corporate margins.
Current consensus forecasts anticipate around 10% earnings growth for US stocks in 2024, well above the historical average of 7.9%. However, towards the end of the economic cycle we typically see earnings roll over as demand weakens. As previously mentioned, slowing revenues amid softening economic conditions can squeeze profit margins.
Overall, we expect US corporate earnings to grow in the mid-single digits rather than optimistic low double-digit projections. Slowing earnings suggests limits to further expansion in equity valuations.
Divergent equity valuations create opportunities
Despite high valuations in the overall US stock market, there is a significant difference between the mega-cap technology stocks (such as the so called ‘Magnificent 7’) and the broader market. Valuation spreads between regions also remain near historic highs. For example, the US market trades at over 20x forward earnings compared to around 10x for UK and emerging markets.
Divergence in valuations creates potential opportunities for skilled active investment managers. An equity can get too expensive or too cheap against where it should be trading. It is more an art than a science so areas of the market can go too far and that enables good managers to generate returns by avoiding overpriced companies or sectors, while investing in areas with more attractive valuations. Managers can exploit the spreads by being selective and protecting against downside risks from expensive stocks. We expect this to be a key source of returns in excess of the movement in market indices, as managers take advantage of mispriced assets.
Economic growth convergence between US and Europe
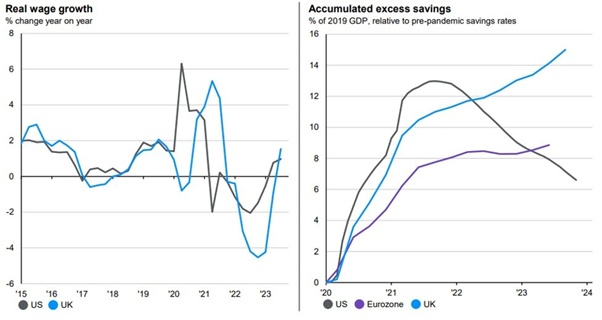
Figure 2: UK & US Real Wage Growth; US, EU & UK Excess Savings, Source: JP Morgan, 2024.
Economic growth is set to slow across most major economies in 2024. GDP growth forecasts dropped to around 1.25% for the US and close to zero for the UK. However, Europe may benefit relative to the US this year. Excess savings remain high in Europe and UK as consumers were unable to spend amid Covid related lockdowns.
As real wage growth turns positive (see left hand chart above) and excess savings are unleashed (see right hand chart), growth could improve. Meanwhile, depleted savings may act as a drag on further US growth. Additionally, fiscal policy support is constrained in the US with large deficits, while EU recovery fund grants have been underspent and could provide a boost to European economies.
Geopolitical tensions increase inflation and market risks
Rising geopolitical tensions appear set to sustain inflationary pressures and market uncertainty in 2024. As the US becomes less willing or able to police the entire globe, smaller powers are disrupting regional orders unchecked. Hotspots include Russia in Eastern Europe, Iran in the Middle East, and China in Taiwan.
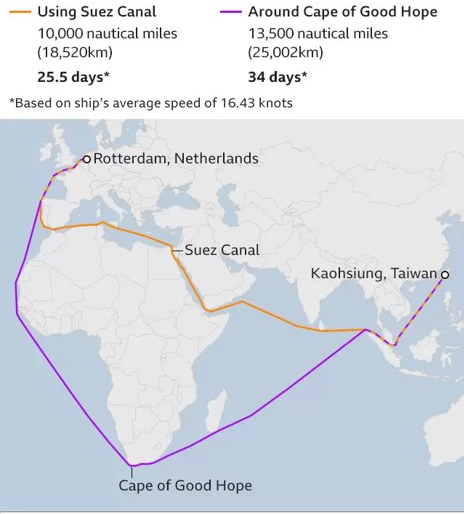
Figure 3: Impact of Red Sea shipping disruptions, Source: BBC News, 2023.
For example, shipping routes are being threatened, with vessels forced into costly diversions to avoid danger zones. Yemen's Houthi rebels have begun attacking ships in the Red Sea, forcing costly diversions around Africa. If China escalated in the vital South China Sea or Russia further disrupted European gas flows, the economic impacts could be even more severe. Overall, declining global stability enables local actors to stir unrest and chaos. This unrest increases the likelihood of spikes in inflation and decrease certainty in forecasting future inflation.
Investors may need to brace for more volatility as factions and spheres of influence fragment the world order. Higher inflation risks remain amid geopolitical uncertainty. Navigating this backdrop requires skilled active management that can adapt to changing conditions and minimize downside risks.
Conclusion
In summary, while inflation has fallen substantially, an uncertain outlook remains for 2024 and the final mile from 3% to the target of 2% will be tough and will require some pain in labour markets.
Given this, it seems that investors could be disappointed by the speed and scale of interest rate cuts until this happens – albeit ‘savers’ will continue to see the benefits of historically higher rates.
The pace of earnings growth has likely peaked, with risks to profit margins as economic growth slows. Divergent regional and sector valuations create opportunities for selectivity and skilled investment management. Geopolitics introduces more volatility and inflation upside risks at a time of moderating growth.
As interest rates fall, we think that bonds will offer good risk adjusted returns to balance the risks of bouts in volatility in asset classes.
If you would like to speak to someone about your portfolio, please contact your TPO adviser.
Arrange a free initial consultation
This Market update is for general information only, does not constitute individual advice and should not be used to inform financial decisions.
Past performance is not a guide to future returns. Investment returns are not guaranteed, and you may get back less than you originally invested.
Tax return deadline looms - avoid a fine!
Were you one of the 4,757 people that filed their tax return on Christmas Day? Or the 12,136 that filed on Boxing Day? It may seem extreme to be doing your tax return over the festive period, but for those diligent people the chore is done for another year – and they have avoided the stress of leaving it too late and risking an automatic penalty of £100. In the 2020/21 tax year around 290,000 were fined.
And it’s not just late filing that can see you paying a penalty. You also have to pay the tax due! In that same tax year a further 1.43 million people were fined for not paying up on time, up from 1.24 million the year before. And that was despite the fact that HMRC waived the late filing and late payment penalties by one month that year, in recognition of the pressures caused by the Covid-19 pandemic.
HMRC has announced that it will only be dealing with priority calls in the lead up to the end of the month, as according to The Times, waiting times to speak to someone for assistance have soared from 5 minutes in 2017 to 20 minutes in 2022.
Who has to send in a tax return
Apparently more than 1 million people will have been drawn into self-assessment for the first time due to the increase in taxes due on everything from savings and dividends to capital gains, because of the freeze in many allowances that was introduced in 2021 and it set to continue until 2028.
And some people could be first timers if the increase to their income, including the State Pension, pushes their income over £100,000.* But there could be other situations too, so, you might be surprised to find that you do need to file a self-assessment tax return.
As there are so many more who may need to do a self-assessment tax return, it could be wise to check if you need to send a tax return if you’re not sure.
According to the gov.uk website, you must send a tax return if, in the last tax year (6 April to 5 April), any of the following applied:
- you were self-employed as a ‘sole trader’ and earned more than £1,000 (before taking off anything you can claim tax relief on)
- you were a partner in a business partnership
- you had a total taxable income of more than £100,000
- you had to pay the High Income Child Benefit Charge
You may also need to send a tax return if you have any untaxed income, such as:
- some COVID-19 grant or support payments
- money from renting out a property
- tips and commission
- income from savings, investments and dividends
- foreign income
What do you need if you have to file a tax return?
If you are filing online you’ll need to have a login to the Government Gateway and you’ll need your Unique Taxpayer Reference (UTR) number.
More information is available on gov.uk, so this is a great reference point especially if you don’t yet have a Government Gateway account. But you really need to get a move on if you want to avoid a penalty.
Remember that HMRC will charge interest on these fines and any unpaid tax and the amount is calculated as base rate plus 2.5% - so currently this is 7.75%. This is bad enough, but if HMRC owes you money because you have overpaid tax, they will only apply base rate minus 1% (4.25%), known as the repayment interest rate! Even more of a reason to make sure you pay up on time and accurately.
*Source: gov.uk
Arrange your free initial consultation
This article is intended for general information only, it does not constitute individual advice and should not be used to inform financial decisions.
The Financial Conduct Authority (FCA) does not regulate tax advice.

Reasons for Investors to expect the unexpected
Investing is inherently risky and will always contain uncertainties. However, by taking risk, investors have a greater potential for higher returns, although this also presents the potential for losses. Nobody can predict the future or factor in every possibility to their plans, but careful portfolio construction can help to limit losses. As we continue to live through uncertain times, with raging wars, potentially changing political environment and the effects of an unprecedented pandemic still being felt, it’s little surprise that investors are feeling nervous. Here we look to outline some key sources of uncertainty and talk through the way The Private Office can help clients to mitigate the effects.
Arrange your free initial consultation
1. What are the sources of uncertainty for investors?
Market Volatility
Volatility is an inherent component of financial markets and reflects the ability to rise and fall suddenly in a very short space of time, due to diversity of sentiment and analysis among investors. Some times sentiment swings wildly one way or another, driving volatility. Equally, external events like elections, natural disaster and geopolitical conflicts can cause markets to react in a swift and violent manner. Recent examples include the Russia-Ukraine war and the Covid pandemic. Investors who, in a state of panic, sold when markets dropped missed the subsequent recovery in asset values. A long-term perspective, therefore, is key to avoid unnecessary losses and to ride out the short-term volatility.
Technological Disruption
Changes to technology is a constant through human existence, although it happens in fits and starts. As such, investors can be caught off guard by rapid changes in technology and the impacts on old industries. Not many foresaw how much Amazon would impact retail or how Netflix would impact media distribution. Looking for technological trends can help investors avoid being left behind.
Regulatory Changes
Changes to laws, regulations and government policies can have large impacts on investors and their portfolios. It is, of course, very difficult to predict changes in regulation, but you may choose investments that have a lower regulatory risk level – for example investments in firms that are aiming to reduce environmental impact reduces the risk that they fall foul of future environmental regulation and consequently suffer fines.
Geopolitical Shocks
Markets often undergo significant turbulence during times of acute uncertainty, and geopolitical shocks often raise the spectre of great uncertainty due to the wide degree of possible outcomes, ranging from swiftly negotiated peace all the way through to world war. As such, conflicts increase the price of risk to market participants, thus causing asset prices to decline in the immediate term. This is to say nothing of the impact on supply chains of ongoing wars – the Russia-Ukraine conflict being a good example, with the outbreak of the war causing a spike in energy and grain prices. Geographical diversification is a key to help minimising this risk.
Business Scandals & Contagions
Business scandals, often involving fraudulent accounting and business practices, understandably have serious impacts on the asset values of the involved companies, however investors often tar entire industries with the same brush, causing sector wide selloffs. Enron’s 2001 collapse is a good example, as it resulted in a period of heightened volatility across the energy sector. Avoiding concentrated positions can minimise this risk.
Economic Shocks
Economic data that is wildly out of the consensus expectations often causes sharp moves in financial markets, as investors incorporate this new data into their outlook on the world and thus their asset allocation frameworks. A recent example of this is the flare up in inflation in 2022 and the subsequent interest rate hikes by central banks. Rising costs of financing causes investors to reappraise the fundamentals of many of the companies they invested in and to change investment strategies. Keeping an open mind and assessing a wide variety of outcomes can help partially mitigate this risk.
Black Swan Events
Black Swan events get their name from the Victorian belief that a black swan did not exist, only for explorers to find them living in Australia. As such, events that are incredibly unlikely, but impactful, are called Black Swan events. The outbreak of the Covid pandemic is an example of a Black Swan event. By definition, these events catch investors off guard. Only by creating robust risk-modes and stress testing portfolios can you then help limit the impact of these events.
Overconfidence & Biases
Humans are prone to biases when making decisions: loss aversion, overconfidence and confirmation bias can hurt investors and lead to bad decisions. Remaining disciplined and working with an adviser to understand your own biases can reduce the risk of making poor investment decisions.
Complacency & Herding
Another very common mistake among investors, particularly the inexperienced, is to follow the crowd. “How can this be a bad investment if everyone else is buying?”. As everyone rushes out, it can result in spectacular losses in a short period of time – the late 90s tech bubble crash is a good example. This behaviour can be common in social situations but can be financially damaging as a result of losses when the tide turns. Once again, diversification is a way to help avoid these outcomes.
2. How to deal with uncertainty
Diversification
Diversifying your portfolio across asset classes, geography and sectors is key. Concentrated positions increase investment risk from all those mentioned above, market volatility, regulatory changes, technological disruption and business scandals. By allocating between multiple countries, you help avoid the risks that geopolitical events in one country bring your whole portfolio down. Creating portfolios with equities, fixed income and alternatives lowers correlated risks due to economic shocks and black swan events. Correlated risks are risks that are correlated to each other, for example inflation and interest rate risk are correlated (when inflation rises, often interest rates do too) so if your equity holdings are susceptible to pressures on margins from inflation, as well as suffering from a high debt load that is impacted by interest rate rises, you are exposed to two correlated risks.
Time in the market (not timing the market) is key
A long-term investment mindset stops investors from panic selling at the bottom and herding into the same assets as everyone else. Through history, equity markets have consistently risen over the decades even if they have fallen over short periods. Timing the markets can be a fool’s game with only 18% of hedge fund managers getting it correct the majority of the time.
How we can help
At The Private Office, our investment philosophy is to create long-term, diversified portfolios that benefit from the structural trends shaping society, while mitigating risk through a diversified allocation across geographies and asset classes. We aim to reduce risk by avoiding keeping all eggs in one basket whether those 'eggs' are countries (geography) or types of investment (bonds, stocks, alternatives). Our advisers compliment this with advice that keeps clients-long-term interests in mind with their own tailored investment strategy, to help avoid rash decisions that can harm your financial outcomes.
Arrange your free initial consultation
This article is intended for general information only, it does not constitute individual advice and should not be used to inform financial decisions.
Investment returns are not guaranteed, and you may get back less than you originally invested.
Past performance is not a guide to future returns.

How to make your child a millionaire before 40!
Most parents would like to ensure their children have a strong financial footing when they are older, but don’t always know the best way to do this. There are many ways to support your children financially throughout their lifetime, but what if there was a way to make them a millionaire before they even reached retirement age? Here we look at the best ways to put money aside for your children and how you can maximise the benefits of compound interest to make your child a “millionaire”!
Arrange your free initial consultation
The first step to saving for your children’s future is understanding your saving options. Here are the most common options that benefit from tax-free growth:
Junior ISA(JISA)
From the day a child is born you can put money into a JISA for them. The current contribution limit is £9,000 per tax year (or £750 per month) and you have the choice of a Junior Investment ISA or a Junior Cash ISA. The most important benefit of a JISA is that any gains made, or interest earned will be tax-free!
If we assume you receive an average annual net return of 5% per year and you save the maximum of £9,000 every tax year, from the day your child is born until they turn 18, you will have contributed a total of £162,000 to their account. However, due to the magic of compound interest (where you earn interest on interest), they will have a pot of over £265,000 saved in a tax-efficient wrapper, what a great 18th birthday present!
At their 18th birthday they can transfer their JISA into an Adult ISA to continue to receive tax-free interest/ investment returns.
Junior Self-Invested Personal Pension (Junior SIPP)
Setting up a pension up for your children may seem like you are overly preparing but this can actually give your children a significant head start. The maximum you can currently save into a Junior SIPP is £2,880 per tax year, and the UK government will add tax 20% tax relief of £720 per tax year, which would bring the total contribution to £3,600. If you can contribute to your child’s Junior SIPP for 18 years and again assuming a 5% growth rate, you will have contributed £51,840 but their pension pot will be worth £106,340 due to the added tax relief. If your child doesn’t contribute to the pension again, by age 57* they could have a pension pot worth around £712,986. Similar to the JISA, any gains made within the SIPP are exempt from tax, and based on current pension rules, you can take up to 25% as a tax-free lump sum upon reaching retirement age.
Recent statistics released by the Office for National Statistics (ONS) stated how the average pension wealth for all persons in the UK is £67,800 at age 57*, highlighting how starting to save early can set your child up for their future and give them a greater opportunity in retirement or even to retire early.
How to make your child a millionaire!
And this is how to do it! If you do the following and assume a 5% growth rate per annum:
- Open a JISA before your child’s first birthday and contribute £9,000 every year until age 18. This results in a total contribution of £162,000 (18 years x £9,000).
- Open a Junior SIPP before your child’s first birthday and contribute £3,600 (including tax relief) to the Junior SIPP every year up to their 18th birthday. This totals 18 years x £2,880 (or £3,600 with tax relief) which equals £51,840 (£64,800)
This would mean you will have contributed a total of £226,800 (including tax relief) to the JISA (£162,000), and Junior SIPP (£64,800). At age 18 when you stop contributing, they could have a total net worth of £372,191 when taking into account compound interest and growth. If they leave this money invested and continue to achieve 5% per year growth, by age 39 they could have a total net worth of just over £1million (£1,036,911), although the funds in the pension would not be accessible until age 57*.
At that point the pension fund could have grown to £712,986, while the ISA, could be worth £1,782,465 if it remained untouched too - an extraordinary total of almost £2.5m. That is a gift worth giving.
The power of starting to save early
Using the same assumptions as above, with a 5% annual growth rate and maximising both Junior SIPP and JISA contributions until age 18:
| Starting from date of birth | Starting at age 5 | Starting at age 10 | |
|---|---|---|---|
| JISA Value at age 30 | £477,430 | £300,604 | £162,056 |
| Junior SIPP value at age 30 | £190,972 | £120,242 | £64,823 |
| Total Value at age 30 | £668,402 | £420,846 | £226,879 |
This shows the benefits you can provide by starting the process of saving early for your child through compounding the interest or investment returns. This is a representation of how you can save for your children and assumes maximum contributions are made at each birthday, but we understand the circumstances for each parent and child will be different and may require different forms of financial planning, such as monthly contributions instead of lump sums.
Despite the examples above, it is never too late to start. If you would like to understand how, The Private Office can structure savings and investments for you and your children to help provide the whole family with a strong financial future. So why not get in touch for a free initial consultation.
* Based on current pension regulation, where the normal minimum pension age is increasing to age 57 from April 2028.
If you would like to know more about this topic, one of our Partners Kirsty Stone appeared on BBC Radio 4 Money Box live, giving her suggestions in a programme all about saving for children.
Arrange your free initial consultation
This article is intended for general information only, it does not constitute individual advice and should not be used to inform financial decisions.
All the calculations in this article assume that lump sum contributions are made for 18 years, from birth, unless otherwise stated, to the 17th birthday and are not adjusted for inflation.
The Financial Conduct Authority (FCA) does not regulate tax or cash advice.
The growth rates provided are for illustrative purposes only. Investment returns can fall as well as rise and are not guaranteed. You may get back less than you originally invested. Investments may be subject to advice fees and product charges which will impact the overall level of return you achieve.

Autumn Statement – what the announcements mean for your finances
Chancellor Jeremy Hunt promised to ‘reduce debt, cut taxes and reward work’ in his ‘Autumn Statement for growth’, but what might the changes he announced mean for your personal finances?
In the lead up to the Autumn Statement, we discussed the changes that were rumoured to have been announced in this article.
Arrange your free initial consultation
These speculated changes included:
- Reducing Inheritance tax
- Announcing an additional ISA allowance for investment into UK companies
- Changing the state pension triple lock calculation to limit next year’s state pension increase
In the end, none of these changes were introduced, with shadow chancellor Rachel Reeves claiming Hunt wanted to reduce inheritance tax but that he “couldn’t get away with it in the middle of a cost of living crisis”. Instead, the headline grabbing change was the 2% reduction to employee national insurance contributions between £12,571 and £50,271. This will equate to an annual saving of c. £754 p.a. to those earning over £50,270 p.a. with effect from January 2024. Additionally, there were National Insurance reductions for the self-employed, with Class 2 contributions effectively abolished and Class 4 contributions reduced from 9% to 8% between £12,571 and £50,271 with effect from April 2024.
However, this will only go part of the way to make up for the impact of the continued freezing of the income tax bands, which will remain frozen until 2028. Indeed, as a result of higher inflation, higher interest rates and frozen tax bands, the Office for Budget Responsibility (OBR) states “Living standards, as measured by real household disposable income per person, are forecast to be 3.5 per cent lower in 2024-25 than their pre-pandemic level.”
Separately, the speculated ISA allowance increase for investments into UK companies did not materialise and pensioners will be pleased to hear Mr Hunt state the government will “honour our commitment in full” as the state pension rises by 8.5% next year.
Regarding pensions, workers will hope a new legal right for their new employer to pay into their previous defined contribution pension scheme will simplify pension planning going forward and will mean an end to the accumulation of multiple schemes as individuals move between companies.
This was an Autumn Statement with half an eye on an upcoming general election, with announcements that should put more money in the pockets of workers and pensioners alike. Mr Hunt repeatedly referred to the OBR’s forecasts during his announcement as he tried to rebuild credibility, a little over a year after Liz Truss and Kwasi Kwarteng’s ‘mini-budget’, prior to which the OBR was not asked to run forecasts. Overall, Mr Hunt will have been grateful that he was able to use some of the fiscal headroom provided by then Chancellor, now Prime Minister, Rishi Sunak’s decision to freeze income tax bands back in 2021 to offer a national insurance cut and significant state pension rise to the voting public.
Arrange your free initial consultation
The opinions shared in this article are solely those of the individual and they do not necessarily reflect those of The Private Office.