Skip to main content
Inflation drops to 2.8%... but can it last?
The rate of inflation in the UK has dropped more than anticipated to 2.8% in the year to April, according to the latest figures from the Office for National Statistics (ONS). This is a notable drop from the 3.3% figure in the year to March.
Inflation continued to ease even as fuel costs climbed in the wake of the Iran conflict.
Data from the ONS showed petrol averaged 156.8p per litre last month, marking its highest level since November 2022. Diesel prices also jumped by more than 30p in April, pushing the average cost up to 190p per litre, the highest recorded since July 2022.
According to the RAC, petrol prices have continued to rise in May, reaching a new peak of 158.52p per litre on Tuesday.
So why has inflation fallen this time, and will it stick?
According to the ONS, energy costs had fallen thanks to a combination of reduced wholesale prices and the government’s energy bill support measures introduced before the Iran conflict began.
But economists are warning that inflation is likely to be on the rise again soon, potentially hitting around 4% by the end of the year, with ongoing tensions in the Middle East continuing to drive up global prices.
It’s also important to note that it can often take about a year for food supply cost changes to truly be reflected in food prices in the UK, so there are likely to be some price shocks as the economy catches up to the supply chain issues caused by the conflict.
What is inflation and how is it measured?
Inflation is a measure of how the prices of goods and services have increased over time. Goods are tangible items sold to customers, such as food, while services are tasks performed for the benefit of recipients, such as a haircut. Generally, this increase is measured by considering the cost of things today compared to how much they cost a year ago. The average increase between these prices is demonstrated in the inflation rate.
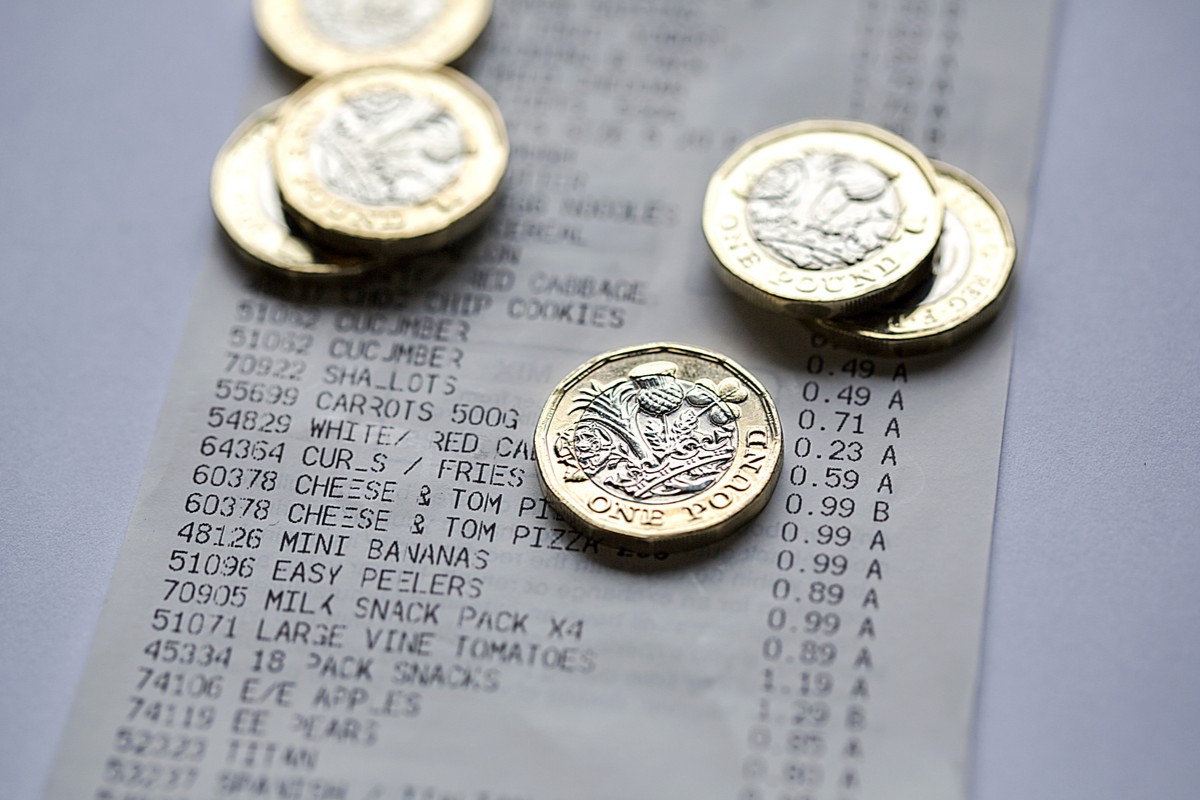
Rising inflation directly affects the cost of living. For example, if the price of a bottle of milk is £1, and inflation is increasing by 5%, then your bottle of milk will cost you 5p more. Or, in other words, the spending power of your money has decreased by 5%.
Ideally, the Government wants to keep inflation low and stable. The general mandated target for the Bank of England is 2%.
Anything significantly above or below this target is thought to cause issues for the economy.
The cost of living surged in recent years, with inflation peaking at 11% in 2022 - way above the Bank of England's 2% target, partly due to the increase in energy prices following Russia's invasion of Ukraine.
While the rate has dropped, falling inflation does not mean the goods and services are coming down in price overall, it is just that they are rising at a slower pace.
Our chartered financial advisers are expert and unbiased, meaning that they can give whole of market advice, and so are best placed to give you a plan tailored exactly to your personal financial goals.
If you’d like to know more, request a free non-committal initial consultation with one of our team or give us a call on 0333 323 9065 and get in touch.
Arrange your free initial consultation
This article is intended for general information only, it does not constitute individual advice and should not be used to inform financial decisions.
Markets rebound despite energy supply crisis
April marked a sharp change in tone for global markets. After a difficult March dominated by geopolitical tension and concerns over slowing growth, investors returned to risk assets with renewed confidence. While uncertainty surrounding the Iran conflict remained unresolved, markets increasingly focused on resilience: strong corporate earnings, renewed momentum in artificial intelligence, and an economy that, for now, continues to absorb higher energy prices better than many feared.
Arrange your free initial consultation
Equities
The result was a broad rebound in global equities, led once again by the technology sector.
Following a challenging backdrop in March, global equities rebounded sharply last month as risk appetite strengthened and markets discounted ongoing geopolitical uncertainty. AI leadership reasserted itself after the technology sector experienced one of its weakest periods of relative performance in fifty years, with investors rotating back into hyperscalers (large scale providers of global data centres) and AI infrastructure.
This bolstered the tech-heavy U.S. market, which also benefited from its status as a net energy exporter insulating it from the Iran conflict and a robust earnings season where 84% of S&P 500 companies exceeded expectations.
Internationally, returns were largely a function of technology concentration. This favoured Asia Pacific ex-Japan, which is home to companies such as TSMC and Samsung; meanwhile, UK equities underperformed, driven by the weak performance of the consumer staples and utilities sectors, which lagged as investors favoured growth over defensive assets.
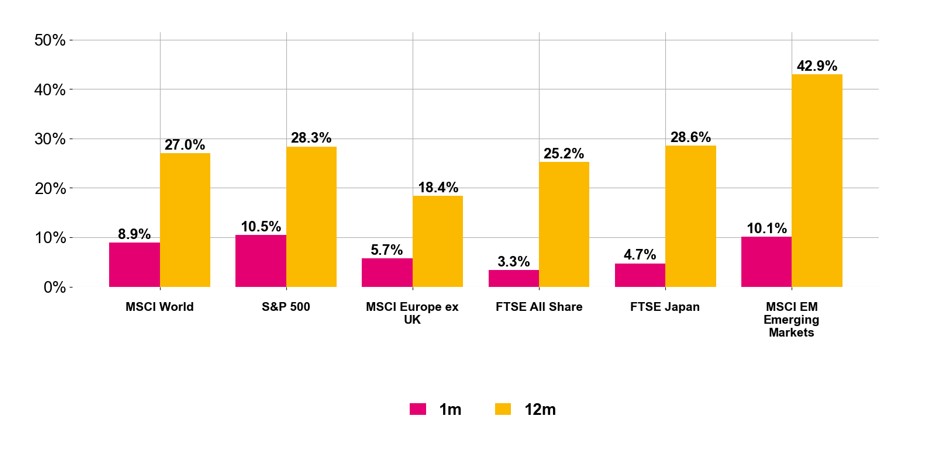
Figure 1. Equity market returns (May 2026, Source: Pacific Asset Management)
Fixed Income
Fixed income markets faced another challenging period as persistent hawkish central bank expectations kept government bond yields elevated through April. Policymakers broadly maintained their cautious stance, acknowledging that rising energy prices present upside risks to inflation and downside risks to economic growth. As a result, investors aggressively repriced the trajectory of monetary policy, with markets now factoring in potential rate hikes, a sharp reversal from the pre-conflict consensus of easing.
The path forward hinges on the duration of the Iran conflict; a protracted engagement increases the likelihood of a policy mistake, specifically the risk of raising rates into a weakening growth environment. While the fiscal profligacy of governments remains a structural headwind for bond markets, investors are increasingly pricing in higher inflation driven by energy costs. This can be seen in the US 30-year yield, which has moved in tandem with rising oil prices (see Figure 2.).
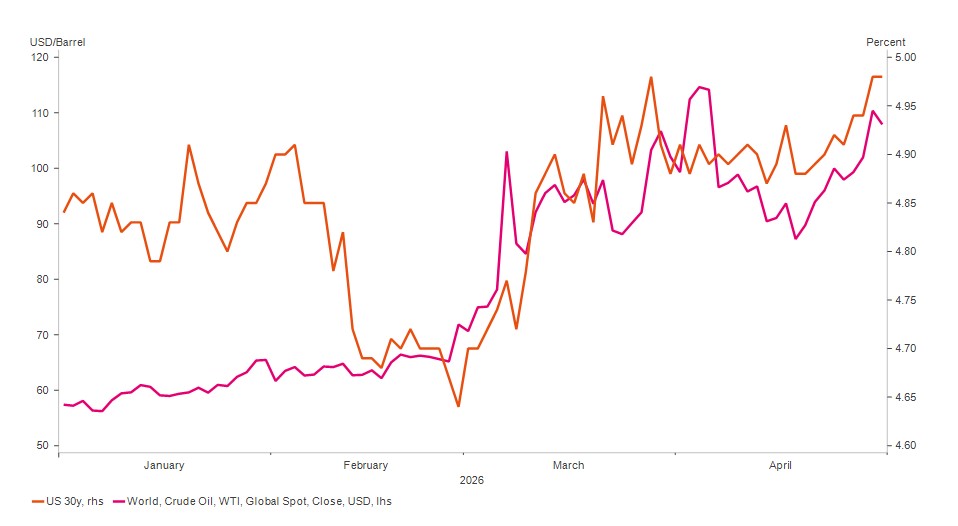
Figure 2. US 30yr yield and price of Crude Oil (May 2026, Source: Pacific Asset Management)
Oil & the 1970’s
As shown above, oil prices fluctuated significantly in April, retreating on ceasefire optimism before rebounding as negotiations reached an impasse. The disruption in the Strait of Hormuz has sharply tightened global supply, echoing the 1973 embargo and its legacy of entrenched inflation and stagnant growth.
This surge threatens to permeate supply chains and household budgets by driving up transportation and industrial input costs. While the modern economy is structurally more resilient than in the past, the current price deviation from historical norms remains stark. Crucially, however, historical context is required: on an inflation-adjusted basis, oil would need to surpass $170 per barrel to match the true severity of the 1970s crisis (Figure 3).
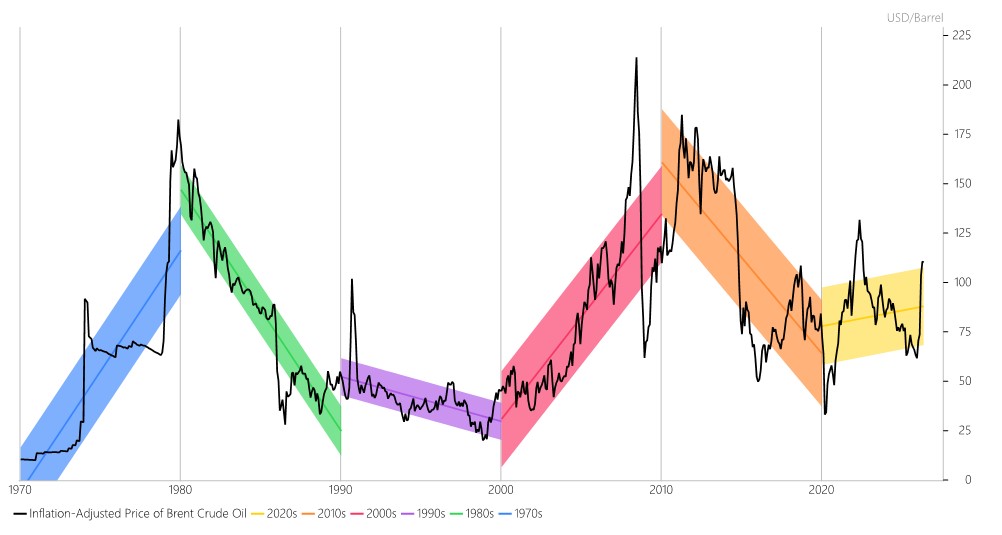
Figure 3. Crude Oil Inflation-Adjusted Price Trends by Decade (May 2026, Source: Pacific Asset Management)
The impact of oil price volatility is rarely isolated to a single sector; rather, it permeates the entire global economic landscape. Because energy is a foundational input for a vast array of goods and services, price swings exert a pervasive influence, simultaneously stoking inflationary pressures and acting as a ‘tax’ that can stifle consumer demand. Furthermore, the relationship between oil prices and asset returns is inherently non-linear. While moderate price increases might occasionally reflect healthy global growth, sudden supply-side shocks can trigger abrupt shifts in corporate profitability and investor sentiment. This complexity makes portfolio construction particularly challenging, as the economic transmission of energy costs often moves faster than traditional market hedges can adjust.
The Inflation Tipping Point and Asset Correlation
Historical market regimes demonstrate that the relationship between stocks and bonds is sensitive to the prevailing inflation environment. While there is no universal ‘magic number’, a clear shift typically occurs when inflation persists above the 2.5% to 3.0% range. Below this threshold, bonds often act as a reliable hedge against equity downturns, maintaining a negative correlation that protects portfolios. However, once inflation breaches this tipping point, as evidenced during the 1970s, the correlation frequently turns positive. In such environments, both asset classes tend to decline in tandem, as rising interest rates lead to higher yields as investors demand more compensation, causing bond prices to fall while simultaneously squeezing equity valuations. This shift effectively limits the portfolio of its traditional built-in protection.
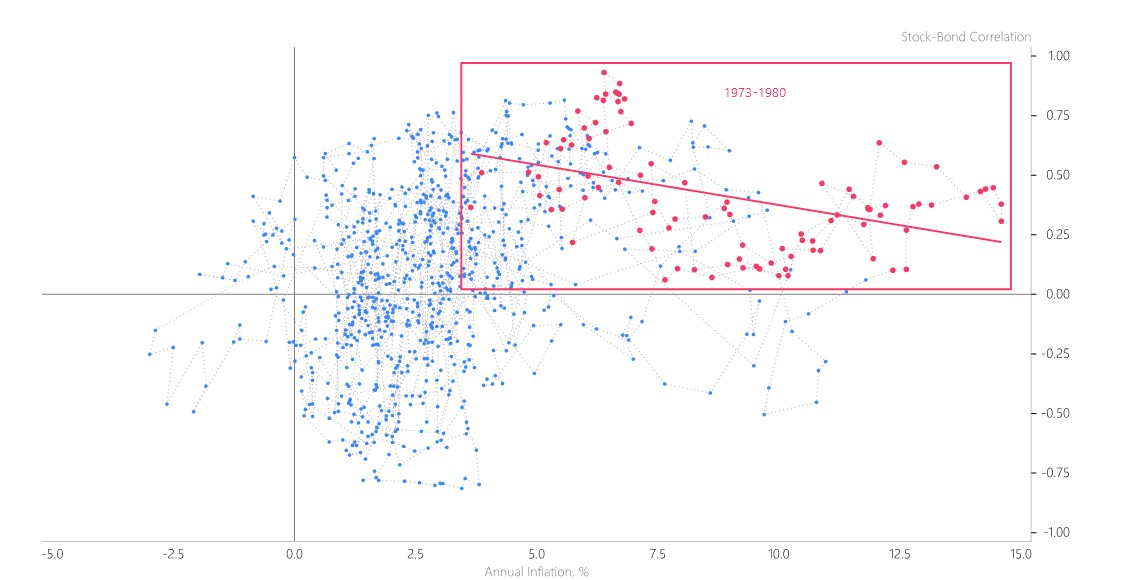
Figure 4. US Equity-Bond correlation (May 2026, Source: Pacific Asset Management)
In the current environment of geopolitical instability and energy-driven inflation, the traditional static 60/40 portfolio is facing a significant structural test. When the negative correlation between stocks and bonds breaks down, a passive, ‘set-and-forget’ approach no longer provides the defensive cushion investors expect.
Ultimately, we believe investors will be rewarded for being proactive; by recognising shifting market leadership and remaining agile, they can better capture emerging opportunities while navigating the complexities of this new market regime.
Most importantly, we ensure that portfolios remain well diversified and positioned to navigate periods of uncertainty while continuing to capture opportunities as markets evolve.
If you have any questions about your own portfolio or more general concerns in this period of heightened uncertainty, do contact your Adviser or contact us centrally through our website.
This information in this article is correct as at 14/05/2026.
Arrange your free initial consultation
This market update is for general information only, does not constitute individual advice and should not be used to inform financial decisions. Investment returns are not guaranteed, and you may get back less than originally invested; past performance is not a guide to future returns.

What is the threshold for higher rate tax?
Understanding when higher rate tax applies is an important part of making informed financial decisions. While tax can often feel complicated, the basic structure is more straightforward than many people expect. Knowing how much you can earn before moving into a higher band, what counts as taxable income and what allowances may be available, can help you plan more effectively and avoid surprises.
In the UK, Income Tax is charged at different rates depending on how much taxable income you receive. For many people, the key question is when earnings move beyond the basic rate and into the higher rate band. That threshold matters because it affects how much of your income you keep, how you approach pension contributions and how you think about wider financial planning.
Arrange your free initial consultation
Should I pay any Income Tax?
You only pay Income Tax on taxable income above the allowances available to you. For most people, that starts once income rises above the standard Personal Allowance of £12,570. If your earnings stay below that level, you will often have no Income Tax to pay, although there are exceptions depending on the type of income you receive and whether you qualify for any extra allowances.
It is also worth remembering that Income Tax is not charged on every type of money in the same way. Earnings from work, pension income, rental income and some savings income can all be taxed differently, and some people will have tax deducted through PAYE while others need to report income through Self-Assessment.
In practice, the question is not simply whether you earn money, but how much taxable income you have after any allowances and reliefs are taken into account.
When do you pay higher rate tax?
If you live in England, Wales or Northern Ireland, you start paying higher rate tax when your taxable income goes above £50,270. Income between £12,571 and £50,270 is taxed at the basic rate of 20 per cent, and income from £50,271 to £125,140 is taxed at 40 per cent. Above £125,140, the additional rate is 45 per cent. These are the current bands published by GOV.UK for the 2026 to 2027 tax year.
Scotland uses different Income Tax bands on earned income. There, the higher rate is 42 per cent and begins at £43,663 if you have the standard Personal Allowance, with an advanced rate of 45 per cent above £75,000 and a top rate of 48 per cent above £125,140. That means a Scottish taxpayer can move into higher rate tax sooner than someone elsewhere in the UK.
One detail that often catches people out is that crossing the higher rate threshold does not mean all of your income is taxed at 40 per cent. Only the part above the threshold is taxed at that rate. This is why a pay rise that takes you over the line is still usually beneficial, even if more of your income is taxed.
What is a Personal Allowance?
The Personal Allowance is the amount of income you can usually receive before paying Income Tax. For the 2026 to 2027 tax year, the standard figure is £12,570. For most employees and pensioners, this is the foundation of their tax calculation. It reduces the amount of income that is exposed to tax bands and helps determine when basic or higher rate tax starts to apply.
There is another important point here for higher earners. Once your adjusted net income goes above £100,000, your Personal Allowance is reduced by £1 for every £2 above that level. It falls to zero once income reaches £125,140. This creates a particularly harsh pinch point because you are not only paying higher rate tax, you are also losing part of your tax free allowance as income rises. This is where what’s known as the 60% tax trap kicks in, as it creates an effective 60% tax rate when taking income tax and reduced tax free allowances into consideration. Add in National Insurance and you’re paying a 62% effective rate.
What is Income Tax used for?
Income Tax is one of the main ways the government raises money to fund public services. HMRC states plainly that it collects the money that pays for the UK’s public services. GOV.UK also provides taxpayers with an annual summary showing how Income Tax and National Insurance contributions feed into government spending.
In broad terms, that revenue helps support areas such as health, education, welfare, transport, defence and day to day public administration. The Office for National Statistics also notes that taxes make up the majority of government income. So while Income Tax can feel like a deduction that disappears from your payslip, it remains one of the central pillars of how the state funds essential services.
How much Income Tax will I pay?
That depends on where you live in the UK and how much taxable income you have. In England, Wales and Northern Ireland, someone with taxable income of £60,000 and the standard Personal Allowance would pay no tax on the first £12,570, 20 per cent on the next £37,700 and 40 per cent on the remaining £9,730. That works out as £7,540 at basic rate and £3,892 at higher rate, for a total Income Tax bill of £11,432. The key point is that the higher rate only applies to the slice above £50,270. This calculation follows the current GOV.UK bands.
If you are in Scotland, the same salary can produce a different result because the bands are different. The tax system is not uniform across the UK, so using the right set of rates matters. This is especially relevant for people who are comparing job offers, approaching retirement, drawing income from multiple sources or trying to decide how much of a bonus to take as salary.
A further complication is that your tax bill can change if your Personal Allowance is reduced, if you receive taxable benefits, or if part of your income comes from dividends or savings. Income Tax is simple at the headline level, but once income sources multiply, the true figure can move quickly.
It is also worth understanding the order in which different types of income are taxed, as this can catch people out. Non savings income is taxed first. This includes earnings from employment, self employed profits, pension income and rental income. Savings income is taxed next, which includes things like interest from bank and building society accounts. Dividend income is taxed last. This matters because your non savings income uses up your Personal Allowance and tax bands before savings interest and dividends are taken into account, which can mean those later sources of income are taxed at a higher rate than expected.
For example, if someone in England has a salary of £45,000, savings interest of £3,000 and dividend income of £2,000, their salary is taxed first and uses up all of their Personal Allowance as well as most of the basic rate band. The savings interest then sits on top of that salary, and the dividend income sits on top of both. Even though none of the income sources looks especially large on its own, the order they are taxed in can push part of the interest or dividends into a higher band. That is why it is so important to look at your total income as a whole rather than viewing each source in isolation.
How to minimise the tax you pay
The starting point is to make full use of the allowances and reliefs that are already built into the system. Pension contributions can be particularly valuable because by paying your relief at source (so paying into a pension without the deduction of basic rate tax) this may increase your basic rate tax band which in turn can reduce the amount of income that will be taxed at the higher rate tax band. This can help you reduce the amount of tax you pay at the higher rate or preserve your Personal Allowance if income is above £100,000.
ISAs can also play an important role because returns within an ISA are sheltered from Income Tax and Capital Gains Tax. Salary sacrifice, where available, may improve tax efficiency too, depending on your circumstances. For couples, holding assets and drawing income in the most tax efficient name can also make a meaningful difference over time. None of this is about avoiding tax. It is about using the rules properly and planning ahead rather than reacting once the tax year has ended.
This is where financial planning becomes useful. The higher rate threshold is a point where decisions about pensions, remuneration, investment wrappers and income timing can start to have a much bigger impact. Knowing where the threshold sits is helpful. Structuring your finances around it is where the real value often lies.
If you want to find out more about minimising the amount of tax you might have to pay, you can request a free non-committal initial consultation with one of our team or give us a call on 0333 323 9065 and get in touch.
Arrange your free initial consultation
The Financial Conduct Authority (FCA) does not regulate cash flow planning or tax.
This article is intended for general information only, it does not constitute individual advice and should not be used to inform financial decisions.
A pension is a long-term investment not normally accessible until age 55 (57 from April 2028 unless the plan has a protected pension age).
The value of your investments (and any income from them) can go down as well as up which would have an impact on the level of pension benefits available.
The information contained in this article is based on our understanding of legislation, whether proposed or in force, and market practice at the time of writing. Levels, bases and reliefs from taxation may be subject to change.

Middle East oil crisis creates a slippery slope for markets
Performance in Q1 2026 followed two sharply contrasting trajectories – in sporting terms, it really was a game of two halves (or thirds, to be technically correct)!
The quarter began with equities extending their year-end rally through February, but this optimism was upended in March. The launch of attacks on Iran by U.S. and Israeli forces led to the effective shutdown of the Strait of Hormuz, a vital artery for global oil. This development triggered a spike in market volatility as investors re-priced assets against a backdrop of rising energy costs and heightened geopolitical risk.
Arrange your free initial consultation
Equities
Global equities experienced their worst monthly return since 2022, falling 6.8%, with markets most acutely exposed to energy prices, such as Japan and the broader Asian region, seeing the steepest declines.
European equities sharply sold off, as whilst less dependent on the Strait of Hormuz than Asian economies, they do remain vulnerable to price shocks and supply disruptions with close to 60% of European energy needing to be imported.
Performance across the UK equity landscape was split. Large-cap companies benefited from their international reach and the presence of major oil and gas producers, allowing them to outperform the broader market. In contrast, domestically focused small-cap equities underperformed, as their heightened sensitivity to the UK’s fragile economic outlook weighed on investor sentiment.
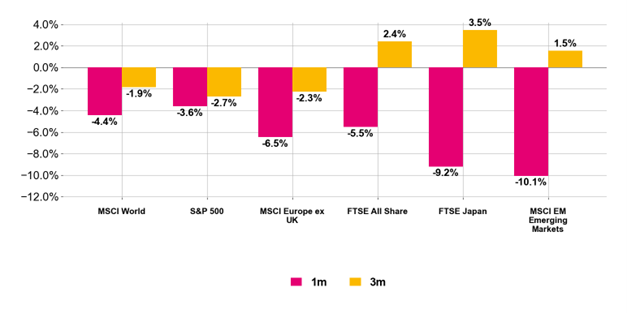
Figure 1. Equity market returns (April 2026, Source: Pacific Asset Management)
Fixed Income
Continuing a post-pandemic trend, government bonds failed to provide the traditional 'safe-haven' shelter investors had become accustomed to during the equity market downturn. This disappointment stemmed from a sharp reappraisal of interest rate trajectories. While developed market yields had been trending lower early in the year, the prospect of conflict-driven inflation in the Middle East abruptly shifted expectations, triggering a broad sell-off across US, UK, and European government bonds in March.
Prior to the geo political escalation, UK Gilts had led sovereign market performance as cooling price pressures fuelled hopes for imminent Bank of England rate cuts. However, the resulting energy shock left the UK - with its high dependence on natural gas - uniquely vulnerable to upside inflation risks. Consequently, the 10-year Gilt yield surged above 5%, marking its worst monthly performance since the 'mini-budget' volatility of 2022.
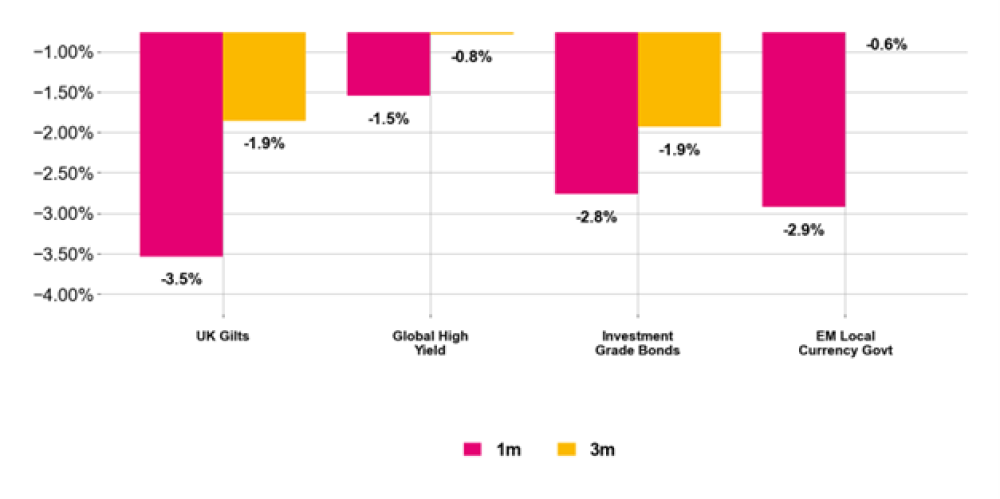
Figure 2. Fixed Income returns (April 2026, Source: Pacific Asset Management)
Commodities
Commodity markets experienced a historic monthly divergence in March, with the energy sector at the epicentre of the shock. Driven by the escalating Middle East conflict and the closure of the Strait of Hormuz, energy prices rallied sharply; Brent crude surpassed the $100-per-barrel threshold, marking its steepest monthly gain in four decades.
In stark contrast, the metals sector faced intense downward pressure. Following a sustained year-long rally, gold plummeted by more than 10%, marking its worst monthly performance since the 2008 financial crisis. This reversal occurred as investors pivoted toward a more hawkish central bank outlook, stripping gold of its safe-haven momentum. The correction likely reflected a wave of profit-taking and deleveraging, with gold and silver serving as primary sources of liquidity during a period of forced portfolio repositioning.
Although the current geopolitical shock has triggered significant volatility, historical precedents indicate that such episodes are typically short-lived in their market impact. We are closely evaluating the evolving consequences for global growth, inflation, and corporate earnings; however, we also recognise that periods of indiscriminate selling can create attractive entry points for disciplined investors.
At this juncture, we continue to advocate for a strategy of prudent risk management while remaining positioned to capitalise on market dislocations as they arise.
If you have any questions about your own portfolio or more general concerns in this period of heightened uncertainty, do contact your Adviser or more generally The Private Office team.
Arrange your free initial consultation
This article is intended for general information only, it does not constitute individual advice and should not be used to inform financial decisions.
Investment returns are not guaranteed, and you may get back less than originally invested; past performance is not a guide to future returns.

ISA changes: why 2026/2027 tax year matters more
The start of the new tax year is often a good time to take stock of your finances, to review what you already have and consider what you need to do next. And in today’s environment, where every penny counts, making full use of the tax allowances that are still available has never been more important.
The ever-popular Individual Savings Account, or ISA is a good place to start. Like a lot of our tax allowances, the ISA allowance has been frozen for many years, so for the 2026/27 tax year, the overall ISA allowance remains at £20,000, offering one of the simplest and most effective ways to protect your savings and investments from tax on interest, dividends, and capital gains.
However, there are changes coming for those who favour the cash element of an Individual Savings Account (ISA).
Cash ISA allowance to be cut
Cash ISAs regained their popularity over the last few years, as interest rates increased, which led to savers paying more tax than they had for over a decade when interest rates were at rock bottom. There is now some £458 billion stashed away in cash ISAs, almost a quarter of the total amount held in cash savings. But for savers under the age of 65, the current tax year is the last chance to make use of the full ISA allowance for cash only deposits.
From 6 April 2027, the rules are set to change. Whilst the overall ISA allowance will remain at £20,000, only £12,000 of that can be deposited into a cash ISA for those aged under 65. To use the full allowance, the remaining £8,000 will need to be invested in a stocks and shares ISA.
To add insult to injury, at the same time that the cash ISA allowance is to be cut, the tax on savings interest will be increasing by 2%. So, a basic rate taxpayer will pay 22% on any taxable interest, it’s 42% for higher rate taxpayers and 47% for additional rate taxpayers, making the cash ISA even more valuable.
The good news is that those aged 65 and over are not affected by this change. They will still be able to place the full £20,000 into cash if they wish, a welcome exemption for older savers. But it highlights a broader policy direction, encouraging younger savers towards investment.
A nudge towards investing
Whilst the comfort of a cash ISA is understandable, particularly in volatile times, it’s important to be aware that inflation can quietly erode the value of savings, and even with improved interest rates, cash may struggle to deliver meaningful real returns over time if inflation is higher than the interest you are earning. So, it might be worth asking yourself whether a purely cash-based approach is the right strategy for the longer term.
This is where stocks and shares ISAs come into play. They are not without risk though as values can go down as well as up. But they offer the potential for growth that cash generally cannot match over the long term, as long as you are prepared to accept the inevitable bumps in the road. You can of course, choose investments that better reflect your own personal attitude to risk, which will help minimise any potential downs and ups.
These changes could therefore be viewed as a prompt to diversify if you don’t need access to your money for the longer term, so more than five years. Using some of your ISA allowance for investment could make a meaningful difference to your future financial health.
Use it or lose it
Given the upcoming changes, this tax year (2026/27) is an opportunity not to be wasted. If you are under 65 and prefer cash, it may make sense to maximise your cash ISA contributions while you still can.
And due to the ongoing conflict in the Middle East, with the expectation that inflation and therefore the Bank of England base rate could rise, savings rates have been increasing recently. Good news for savers, especially those who don’t also have debts.
So, if you have funds sitting in taxable accounts, now is the time to consider sheltering them, as once the tax year ends, you can’t carry it forward.
Don’t overlook the Lifetime ISA
Alongside the standard ISA options, there is also the valuable Lifetime ISA (LISA), which is available to those aged between 18 and 39. The LISA allows you to contribute up to £4,000 per tax year, which counts towards your overall £20,000 ISA allowance and the real attraction is the generous 25% government bonus. In simple terms, a £4,000 contribution is topped up to £5,000, an immediate and very attractive return, even before any interest of investment growth is added.
Traditionally, the LISA has served a dual purpose: helping people save for their first home or for retirement. However, it is currently under review, and there is growing speculation that the retirement element could be removed going forward, making it simply a product for first-time buyers.
In the meantime, for those eligible, it remains a compelling option, particularly if you are saving for your first home.
ISAs for the next generation
It’s also worth remembering that children have their own ISA allowance through the Junior ISA (JISA).
With a current annual allowance of £9,000 per year, the Junior ISA allows parents, grandparents, and others to build a tax-free savings pot on behalf of a child. It can be held in cash or invested, depending on your preference and time horizon.
There is, however, an important point to bear in mind: there is no access to the money until the child turns 18, at which point they gain full control of the account, which could have grown to a really significant amount. The funds become theirs to use as they wish, whether that’s for university, a car, a house deposit, or, indeed, something less sensible.
Alternatively, the funds can be rolled over into an adult ISA, retaining the tax-free status and allowing the savings habit to continue into adulthood.
For those who save for their children, it makes sense to have open conversations with them as they grow older, so that hopefully they will do the right thing with this valuable gift. Financial education is just as important as the savings themselves.
Time to take action
The beginning of the tax year is a great time to make use of your ISA allowance, for a couple of reasons.
First, during the ‘ISA season’ of which April is the pinnacle, cash savings providers tend to compete with each other, which pushes rates higher, providing plenty of choice.
Secondly, why leave your cash in a taxable account any longer than you need to. Although often the headline rates on taxable fixed rate bonds may look higher than the same term cash ISAs, once you deduct income tax, you can earn far more in the tax-free ISA, as the table below illustrates:
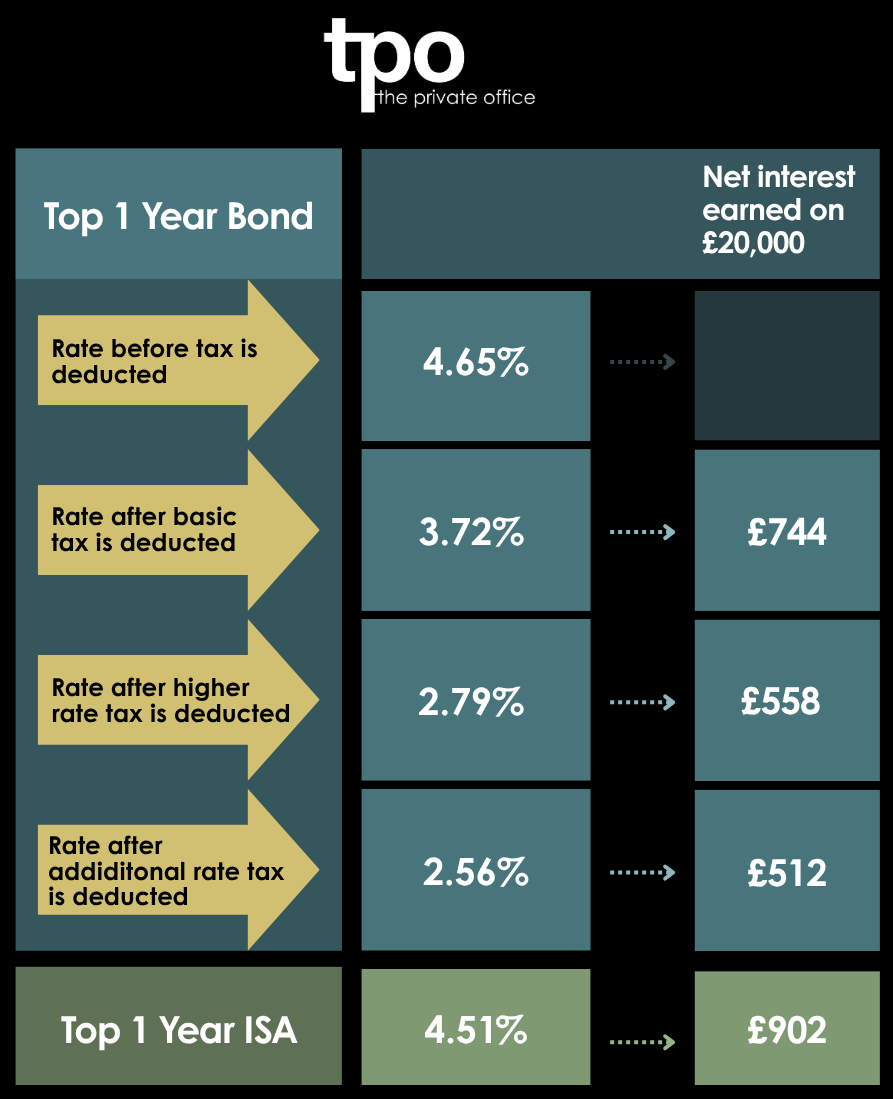
Now is also a good time to review your old ISAs, to see if you could be earning more by switching. The key rule is vital though - never withdraw the funds yourself. Instead, always use the official ISA transfer process provided by your new provider, who will liaise directly with your existing bank or building society. If you take the money out and attempt to redeposit it, it could lose its ISA “wrapper” which crucially means you would forfeit the tax-free status tied to those historic allowances. Given that ISA allowances cannot be reinstated once lost, this is an irreversible and often costly mistake.
Reviewing your old ISAs whilst making the most of your new ISA allowance means that you can make your cash work as hard as possible, particularly important if we are to see inflation spiking upwards once again.
If you want to make your cash work harder, it is important to compare rates regularly and move money when better deals arise. In a market that is shifting and where relatively small rate differences can add up to hundreds of pounds over a year, staying informed is the best way to keep your savings working as hard as possible. Check our best buy tables for the most up to date savings rates.
Arrange your free initial consultation
Rates correct as at 07/04/2026.
This article is intended for general information only, it does not constitute individual advice and should not be used to inform financial decisions.
The Financial Conduct Authority (FCA) does not regulate cash flow planning.

Investing through geopolitical uncertainty
In the last twenty-five years there have been numerous geopolitical events that have led to volatility in markets. Front of mind as we write is clearly the war in Iran, which has caused severe disruptions in oil and gas supplies. Stepping back, however, each geopolitical event brings something to worry about, but the critical question is whether the event is just a source of short-term market noise to be ignored, or a more consequential development that demands action within portfolios.
This article is a follow up to our initial summary of market events from early March.
All geopolitical events are different and require distinct analysis. Most create short-term volatility that is quickly ignored by markets in the callous way that they operate. Some, however, inflict significant damage on the macroeconomic environment, requiring meaningful changes to portfolios. What separates events that cause lasting damage from short-term volatility is their impact on corporate earnings, economic growth, and inflation. What makes these events challenging is that sometimes, they start off terrifying and are quickly resolved (such as the market panic caused by the hedge fund Long Term Capital Management in 1998), whilst others start out as seemingly benign and morph into something far more damaging. What’s critical is having a disciplined process run by an experienced investment team capable of responding as facts change. This often must be done with incomplete information in a highly volatile environment.
Activity within Managed portfolios in March 2026
Earlier this year, several themes performed strongly, including value equities and artificial intelligence opportunities trading at attractive valuations. These areas had delivered strong returns and notable outperformance versus the wider market for portfolios over the past nine months. However, when markets experience a sudden shift in sentiment, positions that have performed well can sometimes move together, even if they are fundamentally different. With that in mind, we took the opportunity to lock in profits and reduce overall equity tracking error. In practical terms, this involved:
Phase I – Tracking Error Reduction
- Reducing allocations to AI-related thematic investments (“AI at a discount”)
- Trimming value equity exposures across EM, US, Global equities.
At the same time, we tactically added exposure to areas where we were previously underweight, including:
- US Mega and Large Cap
- Canadian equities which benefit from higher energy prices
Phase II – Equity Reduction
As it has become increasingly clear that this conflict is likely to continue for longer than President Trump initially envisaged, we have reduced our exposure to equities on a highly tactical basis, with a broad-based reduction across:
- UK Equities
- European Equities
- Japanese Equities
- US Equities
Fixed Income
Fixed income markets have also reacted to the conflict in the Middle East, with bonds selling off as investors reassess inflation and growth expectations. Our positioning within fixed income has been beneficial. Portfolios have been:
- Underweight duration
- Overweight inflation-linked bonds
- No exposure to High Yield (or Private Credit)
This positioning has helped mitigate the impact of the recent move in bond yields.
Alternatives
We sold the small position in UK REITs, which are at risk of higher bond yields and rates in the UK. Gold has been one of the stronger performing assets this year, rising around 8% year-to-date in sterling terms. After the strong rally in January, we reduced our position in gold and gold miners. We are not surprised to see it caught up in a de-risking of global markets. However, we continue to see a strong long-term case for gold as a diversifier within portfolios.
Diversifying assets - adding downside protection
Given the range of possible outcomes from the current geopolitical situation, we have also taken steps to enhance protection against extreme market events within portfolios by adding to our position in the Goldman Sachs Tail Risk Strategy. This provides an additional layer of protection in the event of a sharper equity market decline while allowing us to maintain exposure should markets recover.
Looking ahead
This is clearly a fast-moving situation which we are monitoring closely, and we will continue to adjust portfolios to ensure they reflect our views on the prevailing market conditions.
If you have any questions or concerns about your investments or your future plans, don’t hesitate to get in touch with your TPO Adviser or contact us through our website.
Arrange your free initial consultation
This information in this article is correct as at 30/03/2026.
This market update is for general information only, does not constitute individual advice and should not be used to inform financial decisions. Investment returns are not guaranteed, and you may get back less than originally invested; past performance is not a guide to future returns.

Don’t panic about your financial future, just plan
At the time of writing the Middle East conflict is in full flow. The Straits of Hormuz are effectively closed, and markets are swinging on a daily basis depending upon whether Donald Trump has got out of the left hand side or right hand side of his bed. In short, no one has got the faintest idea what’s happening and by the time this article goes to print, for all I know, the war will be over, and markets would have jumped 10% or, things will have escalated and markets will have fallen 10%.
Arrange your free initial consultation
“Don’t panic Mr Mainwaring” blurted Corporal Jones, in virtually every episode of the classic BBC comedy, Dad’s Army. Of course, no one was panicking, except for Corporal Jones himself and in this state of blind panic, he was the least likely member of the platoon to be able to resolve the predicament they happened to be in. Panicking, generally, does not lead to sound decision making and certainly not sound financial decisions.
There are plenty of reasons to ‘panic’ in today’s world (financially and otherwise) but as Corporal Jones has shown us, panicking gets you nowhere. Life goes on, and the markets go on too and the worst thing investors can do is convince themselves that “this time it’s different”, that the end is nigh and that we all need to grow carrots and store drinking water in industrial quantities.
In their 2009 book “This Time is Different”, the economists Carmen Reinhart and Kenneth Rogoff argue that investors always fall for the trap of believing that the game is up and that capitalism is over and investing is no longer viable. There are always people who come out of the woodwork at these moments in time to endorse and bolster the naysayers, not because their views are valid but because the media is prepared to give them airtime. Funnily enough, we do not hear about them much when markets are doing well which, believe it or not, is most of the time.
The peace of mind a financial plan provides
I’m not pretending that the Iran war isn’t a threat to the world economies, far from it, but I wouldn’t like to bet on markets being lower in a year’s time to where they are now. They might be, of course, but if you want to safeguard yourself against inflation, history has taught us that market exposure is the best way to do it. Cash and bonds generally lose in real terms over the long term.
Markets tend to recover from shocks, whatever they are, and economists call this antifragility, which is the general principle that markets are able to adapt to new conditions. As one source of enterprise closes down, another one opens up and markets always sniff them out, if not immediately, then in time.
It is all well and good to say "don’t panic," but that is much easier to achieve if you actually have a plan in place. The major benefit of having a plan that you regularly revisit is the emotional peace of mind it provides. It moves you away from making knee-jerk reactions based on the morning's headlines and back towards a structured approach. If your personal circumstances change, or the government decides to shift the goalposts on taxes, a quick review of the plan will tell you exactly what needs to be adjusted. By keeping a close eye on your financial roadmap, you can ignore the noise of the markets, knowing that while the path might get a bit bumpy, you are still heading in the right direction.
What we already know
In addition to the “unknowns” (such as the Iran war), we also have the “known” events of future tax changes which are much favoured by the current Labour Government. On going stealth taxes, announced in 2021 as a short-term measure post Covid but now expected to continue until at least 2031. Dividend Tax increase and VCT relief reduction (April 2026); IHT on pensions (April 2027); Mansion Tax (2028) and Salary Sacrifice capping (2029).
In previous articles I have highlighted the dangers of not investing. Just to remind you, in the 20 years from 1st January 2004, $10,000 invested in the S&P 500 would have grown to $66,637 (an annualised growth rate of 9.7%). Had you missed the best 10 days during that 10 years the final sum would have been $29,154 (5.5% annualised growth rate). Take away the best 20 days and it’s $17,494 (2.8%). The message is, of course, stay invested and don’t try to call the markets.
As always, the key is to ensure that you have sufficient liquidity to ride out market volatility. For clients who are nearing retirement, they enter into the ‘decumulation’ - or ‘drawing down’ - phase of their investing life. That is, the scary moment when assets accumulated over decades must now step up to the plate and start delivering actual money to ensure a comfortable retirement. If you don’t plan this properly, you become exposed to what is known as “sequence risk”. This represents a significant threat to portfolios if investments are encashed to meet ongoing expenditure during a market downturn. Risk management planning is vital in retirement to ensure you avoid this pitfall. Investment portfolios need to remain invested, to protect them from long term real value erosion, but for decumulators, the higher risk elements must still be viewed as long term and kept invested for many years, if need be, to await a recovery if the downturn is severe. That’s why the cash buffer is important!
In January 2026, markets were looking bullish, economies were generally on the up and most market commentators were positive about the prospects of equity markets continuing to do well. So, what do we do? Keep calm and carry on investing, or, to quote another Dad’s Army character, hold our heads in our hands and say “we’re doomed!”.
But whatever you decide, the best approach is to have your own personal plan in place, review it with your professional advisers and above all, don’t panic!
Arrange your free initial consultation
This article is intended for general information only, it does not constitute individual advice and should not be used to inform financial decisions.
The Financial Conduct Authority (FCA) does not regulate cash flow planning, estate planning, will writing, tax or trust advice.
A pension is a long-term investment not normally accessible until age 55 (57 from April 2028 unless the plan has a protected pension age). The value of your investments (and any income from them) can go down as well as up which would have an impact on the level of pension benefits available.
Past performance is not a reliable indicator of future performance.

Markets react to rising Middle East tensions
At the start of the year, we described geopolitical risk as a “known unknown.” We expected geopolitics to play an important role in shaping markets, but the timing and scale of any escalation were uncertain. Only two months into the year, that risk has materialised in dramatic fashion, with global geopolitical tensions now reaching their highest level in more than 20 years (see Figure 1).
This sharp rise in tensions has quickly become the dominant theme for global markets and investors.
 Figure 1: Geopolitical Risk Index (Source: Caldara and Iacoviello, March)
Arrange your free initial consultation
What happened?
The escalation followed events on Saturday 28 February, when US and Israeli forces launched coordinated strikes on Iran. The attacks killed Iran’s Supreme Leader, Ali Khamenei, along with several senior Iranian officials. President Trump described the operation as necessary to remove what he called an ongoing threat posed by Iran to the US and its allies, including concerns around nuclear proliferation.
Iran responded quickly, launching missiles at Israel and at American military bases across the Middle East, including strikes in Bahrain, the UAE, Qatar and Kuwait. These developments have significantly heightened tensions across the region and raised concerns about potential disruption to global energy supplies.
How markets responded
Markets reacted swiftly to the news. Major equity indices initially fell as investors assessed the risk of prolonged disruption to global oil and gas supplies.
However, the impact has not been uniform across regions.
US equities proved relatively resilient. The strengthening US dollar provided support, and the United States’ position as a net exporter of oil and gas helped shield its economy from some of the immediate energy-related pressures.
European and UK markets faced greater headwinds, declining by around 7% and 5% respectively. That said, the UK’s significant exposure to energy companies helped cushion some of the losses compared with other European markets.
Asian markets also came under pressure, particularly in energy-importing economies such as Japan, which remain more exposed to rising energy costs.
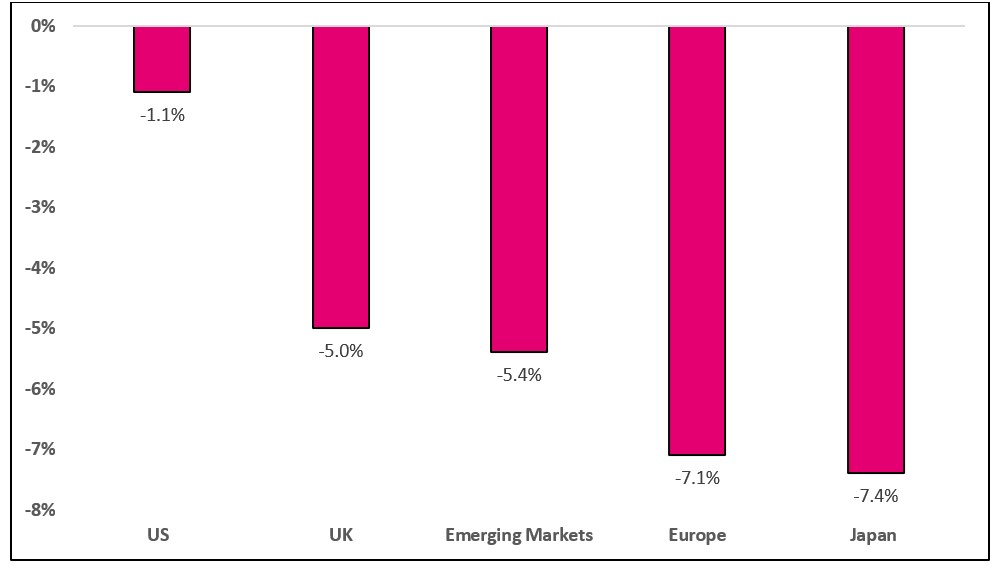 Figure 2: Regional Equity Returns in Sterling (27 February – 11 March 2026, Source: Pacific Asset Management)
Bonds and interest rates
Government bond markets have also reacted to the shifting outlook.
Initially, investors had expected central banks in the US and UK to continue cutting interest rates as inflation pressures gradually eased. However, the surge in energy prices has changed that narrative.
Oil shocks tend to feed quickly into broader inflation because energy costs affect almost every part of the economy. As a result, markets have begun to reassess the interest rate outlook. Government bond yields have moved higher, with UK gilts falling around 2.9% as investors adjusted expectations.
Markets now see a greater likelihood that the Bank of England will keep interest rates at the current level of 3.75% for longer than previously anticipated.
Policymakers respond
A key question now is how long energy prices remain elevated.
Energy shocks are particularly challenging for economies because they can simultaneously push inflation higher while slowing economic growth. If sustained, higher oil and gas prices could reignite inflationary pressures just as they had begun to ease across Western economies.
Policymakers have already begun responding. The International Energy Agency (IEA), which was established after the oil crisis of the 1970s, has authorised the largest emergency release of strategic oil reserves in its history.
The agency’s 32 member nations have agreed to release 400 million barrels of crude oil into global markets. This represents roughly one third of government-held reserves and is more than double the amount released following Russia’s invasion of Ukraine in 2022. The aim is to stabilise energy markets and prevent supply shortages from pushing prices significantly higher.
Looking ahead
The situation remains highly fluid and continues to evolve.
Historically, equity markets often react to geopolitical shocks with an initial period of volatility before stabilising as investors assess the longer-term economic impact. Ultimately, the path of markets will depend on how events affect corporate earnings, energy prices and inflation.
One key risk would be a prolonged disruption to the Strait of Hormuz, a critical shipping route through which around one fifth of the world’s oil supply passes. If this route were to remain closed for an extended period, energy prices could rise further, increasing the risk of higher inflation and slower global growth.
That said, the global economy is far less dependent on oil than it was during the energy crises of the 1970s. Energy supplies are now more diversified, and alternative sources play a greater role, which helps reduce the potential economic impact compared with previous decades.
History also shows that while geopolitical shocks can create short-term volatility, their effects on equity markets are often relatively short-lived.
As we noted at the start of the year, the combination of a more assertive US administration and the approach of mid-term elections increases the likelihood of geopolitical developments shaping markets. In this environment, we remain vigilant and continue to monitor events closely.
Most importantly, we ensure that portfolios remain well diversified and positioned to navigate periods of uncertainty while continuing to capture opportunities as markets evolve.
If you have any questions or concerns about your investments or your future plans, don’t hesitate to get in touch with your TPO Adviser or contact us centrally through our website.
Arrange your free initial consultation
This information in this article is correct as at 12/03/2026.
This market update is for general information only, does not constitute individual advice and should not be used to inform financial decisions. Investment returns are not guaranteed, and you may get back less than originally invested; past performance is not a guide to future returns.

Growth downgraded in Spring Forecast 2026
Rachel Reeves delivered her Spring Forecast this afternoon, which had been overshadowed before it even started by events in the Middle East.
As expected, the Spring Forecast (rather than Spring Statement as it has been referred to in previous years) did not include any fiscal changes, with Reeves previously committing to only holding one fiscal event each year, in the Autumn Budget.
By way of updates, Reeves announced that the Office for Budget Responsibility (OBR) had ‘adjusted the profile of GDP’ resulting in it downgrading its UK Growth projection for 2026 from 1.4% (as forecast in November 2025) to 1.1%, but the OBR increased its forecasts for 2027 (1.5% to 1.6%) and 2028 (again 1.5% to 1.6%). Reeves also heralded the interest rate cuts seen in recent months, but events in the Middle East have significantly reduced the chance of a further cut in March, given the inflationary oil and gas price rises seen since the weekend.
Therefore, the most important upcoming tax changes are those we already knew about, specifically:
- A 2% increase in dividend tax taking effect on 6 April 2026.
- VCT tax relief being cut from 30% to 20% on 6 April 2026.
- Business and Agricultural Relief limited to £2.5m per individual, with effect from 6 April 2026 – this importantly increased from the previously proposed £1m and can be passed between spouses if not used on first death.
- A 2% increase in savings and property taxes taking effect on 6 April 2027.
- A cap in Cash ISA contributions of £12,000 for under 65s with effect from 6 April 2027.
- Pensions forming part of estates for inheritance tax purposes from 6 April 2027.
- A Mansion Tax being introduced in April 2028.
- Salary Sacrifice pension contributions benefiting from National Insurance Contribution savings limited to £2,000 with effect from 6 April 2029.
- Income Tax thresholds frozen until April 2031.
If you would like to discuss the impact of the above on your personal financial situation, why not get in touch for a free initial conversation to see how we can help.
Arrange your free initial consultation
This article is intended for general information only, it does not constitute individual advice and should not be used to inform financial decisions
The Financial Conduct Authority (FCA) does not regulate estate planning or tax advice.
Escalation in the Middle East
On Saturday morning, the US and Israeli forces carried out attacks on Iran, killing the Supreme Leader Ali Khamenei and several other high ranking Iranian officials.
President Trump justified the action as necessary to eliminate the ongoing threats posed by Iran to the US and its allies, including the risk of nuclear proliferation. Iran has retaliated, by launching missiles at Israel and American military bases across the Middle East, including strikes in Bahrain, the United Arab Emirates (UAE), Qatar and Kuwait.
The range of possible outcomes from this intervention is extremely wide, and will depend on two key factors: how long the conflict lasts, and how Iran's political leadership is resolved, whether through an orderly succession or a broader collapse of the regime.
What this means for portfolios
As of Monday morning, there has been a broad sell off in equities and the US dollar has responded sharply.
The FTSE100 has seen more limited falls because of its sector weighting towards energy companies which have rallied on the back of the rising oil price.
Government bonds, which have been trending higher over the past month, have eased back slightly on the risk of energy prices feeding through to inflation.
Oil prices have risen 8% to $78/barrel, not just because of the direct impact on supply through disruptions in the Middle East but also because of the threat of Iranian attacks on the Strait of Hormuz, through which around 20% of global oil supply is shipped.
Once again, gold has proved to be an important source of diversification, with our gold ETF rallying around 4.5% in Sterling as we write. We added back some gold in our core portfolios last week, having reduced our exposure at higher prices in January. This has helped to cushion portfolios on a day when equities and bonds are both falling.
Looking ahead
Clearly this situation is unfolding as we write, and remains highly fluid. Equities always respond to geopolitical events by selling off initially; their subsequent performance depends entirely on the impact of events on corporate earnings and inflation.
If the Strait of Hormuz is unpassable for a prolonged period, energy prices will move higher from here, which will feed through to inflation and weigh on consumption. But it’s worth noting that the dependence on oil has diminished significantly since the early 70s when the Yom Kippur War triggered a severe bear market. Today, alternative suppliers and sources of energy help to mitigate the economic impact compared to the 1970s.
History shows that many geopolitical shocks have relatively short-lived effects on equity markets. We pointed out earlier in the year that with mid-term elections looming and an emboldened President Trump, geopolitical events were becoming more likely.
For now, we will remain highly vigilant and ready to respond whilst ensuring that portfolios remain well diversified.
As ever, we remain long-term investors and whilst short-term market volatility is something that informs our portfolio decisions, the importance remains in the long-term plan and remaining both prudent and disciplined in our planning together.
If you have any questions or concerns about your investments or your future plans, don’t hesitate to get in touch with your TPO Adviser or contact us through our website.
Arrange your free initial consultation
This information in this article is correct as at 02/03/2026.
This market update is for general information only, does not constitute individual advice and should not be used to inform financial decisions. Investment returns are not guaranteed, and you may get back less than originally invested; past performance is not a guide to future returns.