 Skip to main content
Slow and steady stocks eclipse Big Tech in July
July 2026 was dominated by three interlocking themes: a return to hostilities in the Middle East that sent oil prices sharply higher, a reversal in ‘big tech’ stocks, and a US Federal Reserve decision that unsettled bond markets.
Equities
Global equity markets were deeply divided this month, with a wide gap between AI linked companies and traditional businesses. The big story was a sharp drop in AI infrastructure and microchip stocks, triggered by growing investor panic that tech giants might cut their budgets for AI chips. This sell-off was especially prominent in South Korea, where the main stock index relies heavily on memory chip giants Samsung Electronics and SK Hynix. Because of this localised ‘crash’, emerging markets fell behind the rest of the world.
Arrange your free initial consultation
A major driver behind this market reversal involved Situational Awareness LP, the AI hedge fund run by 25-year-old former OpenAI researcher Leopold Aschenbrenner. The fund had grown to $45 billion in assets after gaining over 400% in the first half of 2026.
However, the fund had made significant bets on AI infrastructure stocks whilst betting against software stocks. When the market turned against these positions, the fund's use of borrowed money triggered margin calls (loan repayments) from their banks. As a result, the fund was forced to sell its entire $16 billion stock portfolio in a single block trade in late July. This forced sale shook the market, but once the fund finished dumping its shares, the targeted AI stocks quickly rebounded. Meanwhile, the broader S&P 500 managed to soften its losses thanks to strong gains in healthcare and banking, where trading desks reported strong earnings.
In contrast, UK equities showed strong performance, with the FTSE 100 reaching record-breaking highs throughout the month, a slight improvement from its previous February peak. The index's limited exposure to semiconductor and technology names proved an advantage in this environment, while heavy weightings in well-performing energy and financials acted as a positive tailwind. The FTSE 250 also gained to a lesser extent, with mining and industrial stocks contributing to strong FTSE All-Share performance.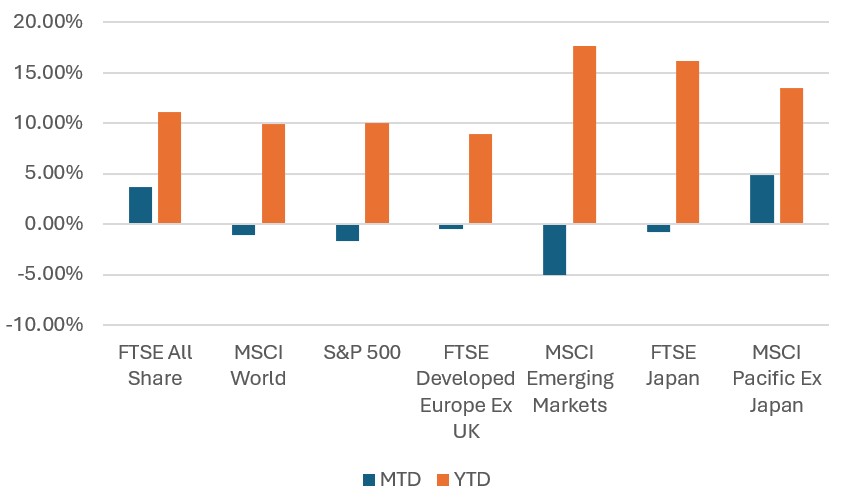
Figure 1: Equity market returns (Source: Bloomberg, July 2026)
Fixed Income
The July US Federal Reserve meeting was one of the more consequential of recent years, even though the Fed held rates steady in a 9-3 vote, with the three dissenters favoring an immediate increase, signaling the growing internal pressure to address concerns of increasing inflation. Chair Warsh's decision to provide no forward guidance, reaffirming only the Fed's unwavering commitment to its 2% inflation target, produced a sharp market reaction given the lack of action to achieve this. The 30-year Treasury yield surged to its highest level since 2007, leading to a marked steepening of the US yield curve, indicating concerns about future inflation and higher long term interest rates.
UK Gilts followed a similar trajectory, as the surge in oil prices over the month rekindled fears that the Middle East conflict could reignite domestic inflation and prompt further Bank of England tightening. The Bank of England voted 6-3 to hold rates unchanged at its July meeting, with three members favoring an increase.
Corporate bonds took a hit from two sides in July
First, a general rise in market interest rates reduced overall bond returns.
Second, the price gap between corporate and government bonds widened as investors grew nervous about the massive amount of debt tech companies are taking on to fund AI.
Big Tech firms have been tapping into both the stock and bond markets to pay for their AI expansion plans. At the same time, the cost of buying insurance against a potential tech default climbed during the month, showing that investors are getting worried about how long this AI build-out will take and how much it will ultimately cost. Fortunately, the price gap for safer, high-quality corporate bonds expanded only slightly and remained well within normal, historic boundaries.
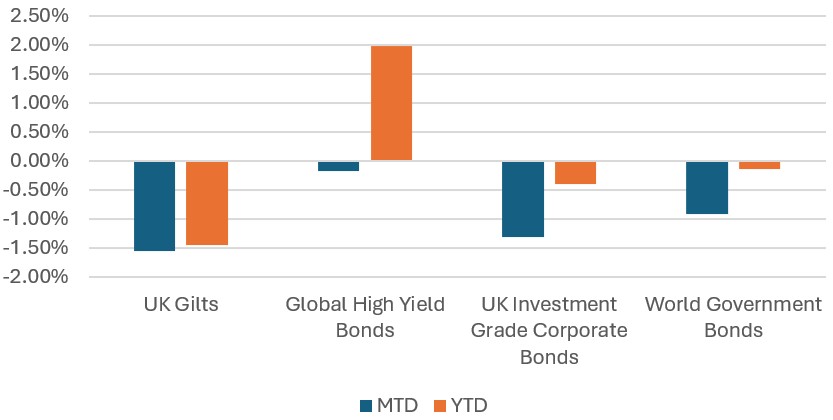
Figure 2: Fixed income returns (Source: Bloomberg, July 2026)
Commodities
Oil reversed June's sharp decline as hostilities between the US and Iran re-escalated through July, with Brent crude climbing back toward $90 a barrel, a reversal that amplified the inflation concerns that had been eased by the mid-June ceasefire. The re-pricing of energy risk fed directly into bond markets, contributing to the long-end yield spike.
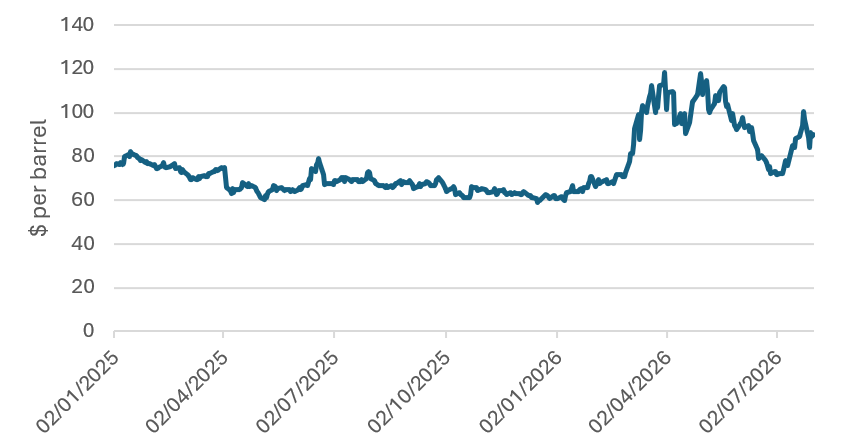
Figure 3: Brent Crude Oil price one-year changes (Source: Bloomberg, July 2026)
Summary
July revealed that investors are growing more anxious about the assumptions that drove the recent AI stock boom. Fears regarding the massive cost, funding sources, and actual profits of AI tech echoed across both stock and bond markets. This anxiety exposed risky, overcrowded bets and forced some major investors to panic-sell.
Added to this, rising energy prices brought back fears of inflation. At the same time, the Federal Reserve refused to give hints about its future plans while doubling down on its 2% inflation goal - even though they left interest rates unchanged. This combination unsettled investors and pushed longer-term interest rates sharply higher.
Even with this drama, corporate profits remained solid and economic growth stayed strong. Ultimately, the month forced a conscious reset on how investors price risk, creating a clear split between different industries and pushing investors back toward safe, steady companies with reliable cash flow. Our portfolios are consciously diversified to thrive in these circumstances; downside risk is controlled as more traditional sector exposure in our portfolios pick up the slack when more fashionable sectors struggle!
If you have any questions about your own portfolio or more general concerns in this period of heightened uncertainty, do contact your Adviser or contact us centrally through our website.
Arrange your free initial consultation
Watch a summary of market activity in July
Download: World Markets At A Glance July 2026
The information in this article is correct as at 13/08/2026.
This market update is for general information only, does not constitute individual advice and should not be used to inform financial decisions.
Investment returns are not guaranteed, and you may get back less than originally invested; past performance is not a guide to future returns.

Financial Conduct Authority looks to regulate AI financial advice
Artificial intelligence (AI) could become a ‘defining force’ in the retail financial services space, according to a new report published by the Financial Conduct Authority (FCA).
Earlier this week, the FCA published the ‘Mills Review’, a commissioned research report that explored the growing use of AI in the retail sector for financial advice and the possible impacts on firms, consumers, and regulators alike.
One of the most notable findings was that one-fifth of people, equivalent to 11m UK adults, would be likely to use AI in personal finance. These tools can act autonomously within pre-set goals, although consumers surveyed by the FCA raised concerns about trusting the ‘algorithm’.
Sheldon Mills, executive director at the FCA, said: “Artificial intelligence will transform financial services by 2030. It creates significant opportunities for consumers, firms and the wider economy. This report sets out a roadmap for how industry regulators and government can prepare for the next phase of AI-driven change in our world-leading financial services sector.”
The risks to pensions were also considered, as AI tools could increase the risk of poor decisions for consumers that rely on incomplete or inaccurate advice outputs – something AI is known to do fairly often across interactions.
What are the recommendations from the report?
The Mills Review presented seven ‘priority’ recommendations to be considered for the FCA Board to consider, which are as follows:
- Secure and adapt the regulatory perimeter.
- Strengthen system-wide coordination and oversight.
- Monitor the transition to autonomous models and adapt regulatory frameworks.
- Scale up the FCA's AI Lab to support AI models and system innovation in financial services.
- Enable the foundations for agentic finance.
- Build and adopt an AI-enabled agentic supervisory model.
- Develop a trusted public-interest AI-enabled financial capability service.
While AI can be helpful in providing basic explanations for financial queries, it is still a very new space and is completely unregulated. AI has been known to ‘hallucinate’ and provide inaccurate or incorrect information. When it comes to making important financial decisions that could have a serious impact on your wealth, it is not a substitute for regulated financial advice.
If you’re interested in seeking real authentic and FCA approved advice to ensure the best possible wealth protection for you or your family, we can help. Give us a call on 0333 323 9065 or book a free no obligation initial consultation with a member of our team to find out more.
Arrange your free initial consultation
This article is intended for general information only, it does not constitute individual advice and should not be used to inform financial decisions.

Markets stay hot in June
Markets continued to be volatile in June but both equity and bond markets ended the month modestly higher. After initial weakness at the start of the month, a ceasefire between the United States and Iran, formalised in a Memorandum of Understanding signed at the Palace of Versailles on 17 June following the G7 summit, was the catalyst to a sharp relief rally across risk assets. Under the surface, there was significant rotation within equity markets.
Arrange your free initial consultation
Equities
US Equities delivered positive returns over the month, supported by US dollar strength, yet with considerable intramonth volatility due to the rotation into and out of AI-related names. Semiconductor stocks continued to surge higher, whilst the “Mag7” stocks fell back. SpaceX completed the largest IPO in stock market history, raising $75 billion and surging 19% on its first day to achieve a market capitalisation exceeding $2 trillion.
In the UK, the FTSE All Share Index rose over the month, mainly driven by FTSE 100 performance, supported by financials, industrials, and a handful of international diversified blue-chips. The more domestically focused FTSE 250 lagged large cap stocks in June.
Emerging Markets (EM) were exposed to similar swing factors surrounding AI supply chain stocks which led to a volatile month, ending with flat performance. Nevertheless, EM continues to benefit from a strong earnings upgrade cycle, with consensus EPS (Earnings Per Share) growth expectations lifted when compared to the start of the year. 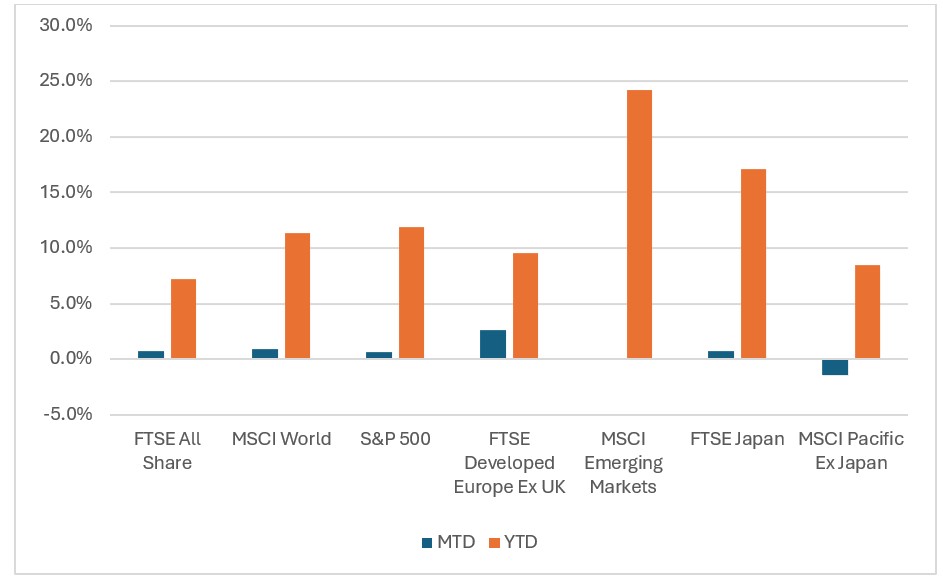 Figure 1: Equity market returns (Source: Bloomberg 2026)
Fixed Income
Sovereign bond markets moved higher even as several central banks, including the Bank of Japan and the ECB, raised interest rates to push back against lingering inflation pressures.
UK Gilts were volatile in June with the political uncertainty surrounding the Labour leadership driving the 10-year gilt yield close to 5%, before retracing as Burnham committed to existing fiscal rules and falling oil prices reduced near-term inflation expectations. The Monetary Policy Committee voted 7-2 to hold interest rates at 3.75%, with two members favouring a rise to 4.0%. The Bank cautioned that inflation is likely to climb again, projecting a return towards 3.25% in Q4 as earlier energy price increases pass through household bills.
The US Federal Reserve held its policy rate steady in June, but the meeting carried added significance under new chair Kevin Warsh, who struck an early hawkish tone, signalling a willingness to raise rates further should inflation risks resurface. Somewhat counterintuitively, this firm stance appeared to reassure markets on the Fed's inflation credibility, helping underpin a broader Treasury rally over the month.
 Figure 2: Fixed income returns (Source: Bloomberg 2026)
Commodities
Oil prices fell sharply over June, moving back in line with pre-Iran War levels. The partial reopening of the Strait of Hormuz sent prices tumbling and eased the inflation concerns that had weighed on markets since the spring. By month-end, Brent crude was hovering around $73 a barrel, down sharply from highs of $118 in late April, marking one of the steepest monthly declines of the year.
After a volatile few months of elevated prices, June's move lower was more directional and sustained, reflecting a market increasingly confident in a durable resolution even as it remained alert to the risk of relapse, with renewed clashes around the Strait resurfacing briefly in the final days of the month.
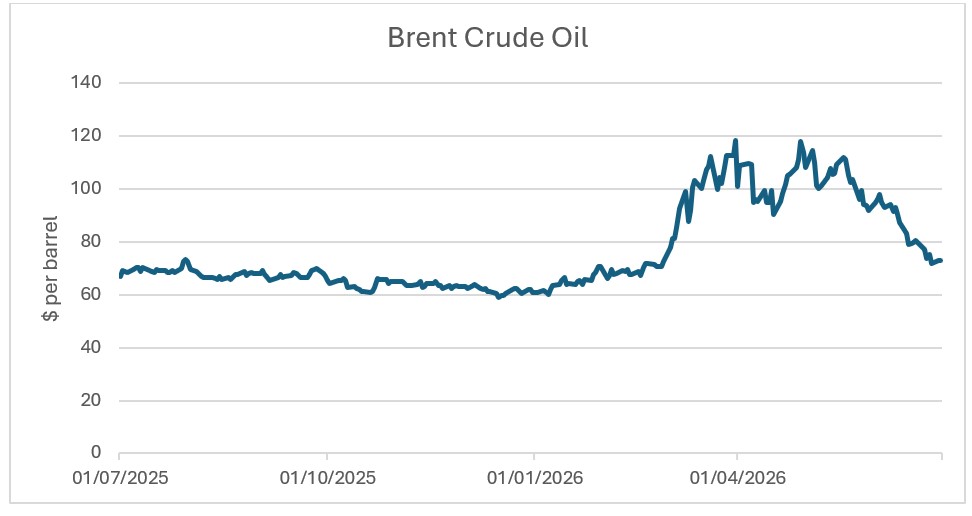 Figure 3: Brent Crude Oil price one-year changes (Source: Bloomberg 2026)
Summary
Overall, the easing of energy-related inflation fears supported a broad rally in sovereign bonds and helped stabilise risk assets, even as renewed tensions near month-end and the AI-momentum rotation kept equity performance uneven.
Looking ahead, June's events have materially improved the inflation and policy outlook. However, the peace agreement remains provisional, the Federal Reserve has turned more hawkish and UK political transition introduces fresh uncertainty.
In a market environment that continues to evolve, diversification and active portfolio management remain key to navigating uncertainty. We continue to monitor market developments closely, ensuring portfolios remain well diversified and appropriately positioned to manage volatility while capturing opportunities as they arise.
If you have any questions or concerns about your investments or your future plans, don’t hesitate to contact your adviser or contact us centrally through our website.
Arrange your free initial consultation
Watch a summary of market activity in June
Download: World Markets At A Glance June 2026
This information in this article is correct as at 09/07/26.
This market update is for general information only, does not constitute individual advice and should not be used to inform financial decisions. Investment returns are not guaranteed, and you may get back less than originally invested; past performance is not a guide to future returns.
AI drives fundamental not artificial growth in markets
Global equity markets maintained their strong momentum in May, recovering from March lows. This rebound was underpinned by a combination of artificial intelligence (AI) optimism, robust corporate earnings and an easing of geopolitical tensions.
Arrange your free initial consultation
Equity returns, however, remained highly concentrated. For the second consecutive month, technology companies outperformed the broader market, fuelled by the scaling of generative AI and surging hardware demand. Conversely, defensive sectors such as utilities and consumer staples trailed as risk sentiment improved. The energy sector also faced headwinds; oil prices fell below $100 a barrel, recording the sharpest one-month decline since 2020 on expectations that the Strait of Hormuz would soon reopen.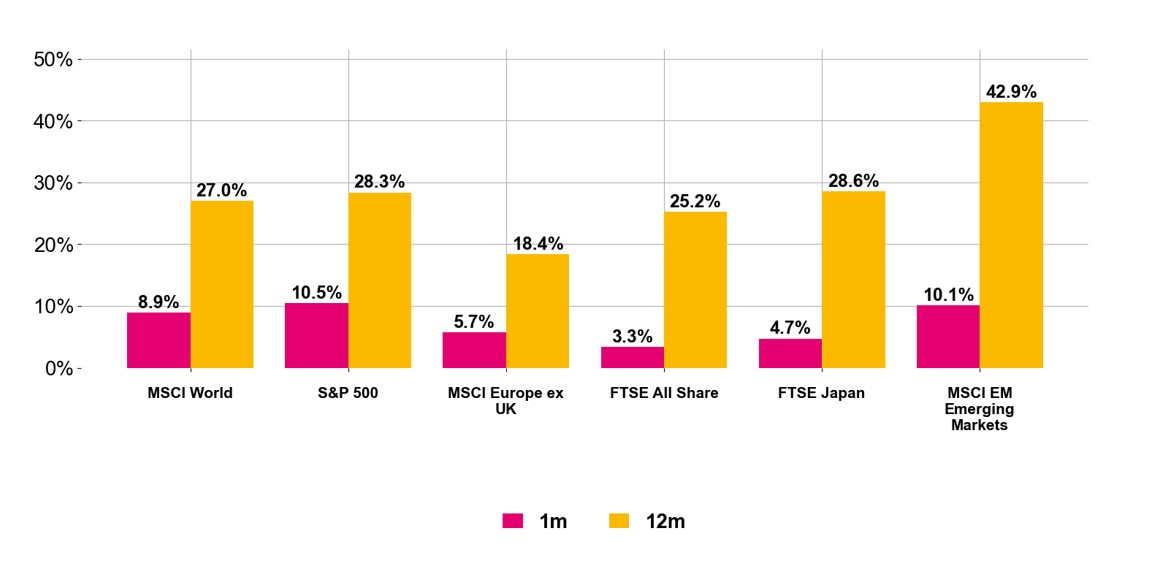 Figure 1. Regional Equity Returns (May 2026, Source: Pacific Asset Management)
This rally particularly benefited regional markets with heavy AI exposure. The US market, home to some of the world’s leading AI innovators, reached new record highs, returning 10.5% in sterling terms and marking its longest weekly winning streak since late 2023.
These gains were supported by another stellar earnings season, with aggregate earnings growing 28.6% year-over-year (YoY). The technology sector led the way with a 54.3% YoY growth rate, driven by notable contributions from Nvidia and Micron, the latter of which officially joined the $1 trillion market cap club in May. Even at the index level, the blended Q1 2026 earnings growth rate of 28.6% sits significantly above the five-year average of 16.4% and the ten-year average of 10.3%.
AI is becoming a driver of economic growth
We are also observing AI capital expenditure which analysts forecast to exceed $1 trillion within two years transcend the micro (company) level to influence macro-economic data. While the U.S. economy grew at a healthy annualised rate of 2% in the first quarter of 2026, a look beneath the surface reveals a fascinating shift in composition: non-residential fixed investment, a proxy for AI infrastructure spend, accounted for nearly 75% of that growth.
The AI-driven capex boom was not confined to the US, Emerging Markets also benefited as investors sought exposure to the AI theme at more attractive valuations than those found among US tech leaders.
South Korea and Taiwan led regional returns, driven by continued demand for memory chips. This saw SK Hynix and Samsung join the $1 trillion market cap club, reigniting the ‘bubble’ debate. However, while recent price action has been extreme, it is supported by fundamentals: Q1 2026 earnings growth in Asia was exceptional at approximately 40%, one of the strongest quarters in recent history as global demand for semiconductors continues to accelerate.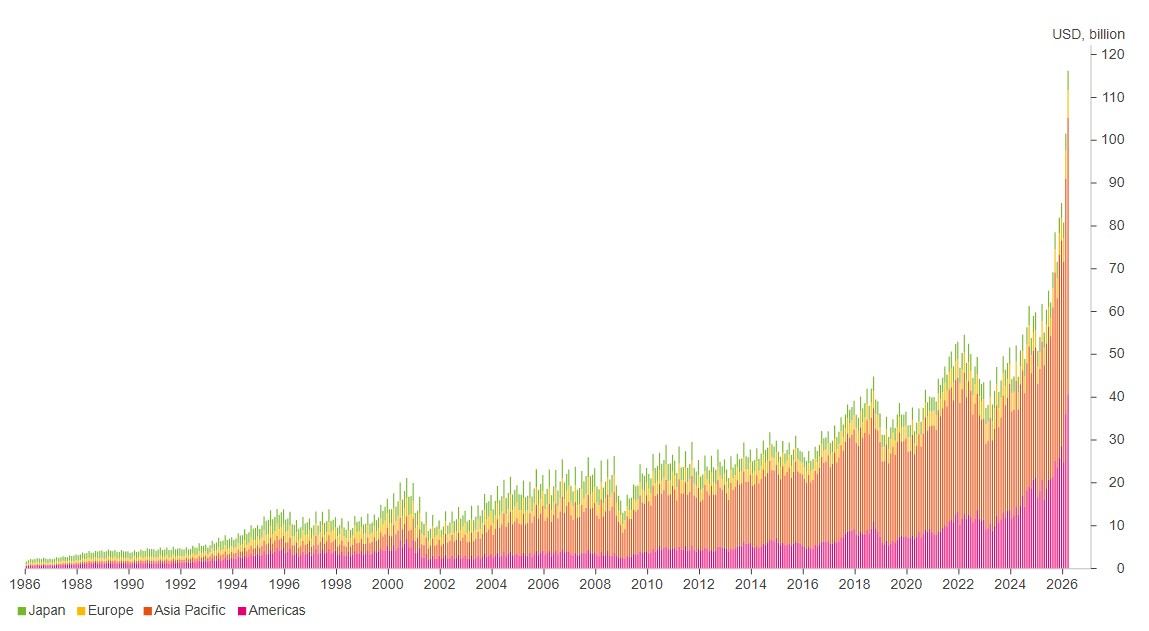 Figure 2. Demand for Semiconductors (May 2026, Source: PAM, World Semiconductor Trade Statistics)
Fixed income: a diverging picture
May was characterised by a distinct divergence in asset class performance. While equity benchmarks hovered near record territory, bolstered by a historic earnings cycle and the persistent expansion of AI infrastructure, sovereign debt markets remained under pressure. This weakness was driven by concerns over persistent inflation and ongoing uncertainty regarding the trajectory of future monetary policy.
UK Government Bonds emerged as a relative bright spot, outperforming the broader global sovereign market. A cooling labour market and lower than anticipated inflation figures provided the necessary tailwinds to drive yields lower toward month-end. This resilience occurred despite considerable domestic political shifts; local election results showed a sharp decline in Labour support, with the party losing roughly 1,500 seats. This suggests a fundamental realignment of the UK’s political landscape, as the traditional two-party dominance gives way to a fragmented multi-party system featuring a significant rise in support for the Reform Party.
The resulting pressure on Prime Minister Keir Starmer has fuelled speculation regarding potential leadership transitions, with figures such as Andy Burnham and Wes Streeting being discussed as possible alternatives. This heightened political uncertainty has introduced a risk premium, which threatens further upward pressure on UK Government Bond yields.
On the global stage, the environment was more challenging. The US 30-year Treasury yield reached its highest level in nearly two decades after April’s CPI reading showed inflation rising to 3.8%, driven by elevated energy prices. In Japan, sovereign yields climbed to forty-year highs following Prime Minister Takaichi’s announcement of a supplementary fiscal budget designed to shield the domestic economy from rising energy costs.
Conclusion: strong markets, narrow leadership
Global markets remain in a state of fragile equilibrium. While an exceptional earnings season has provided a robust foundation for current valuations, this support is increasingly concentrated within a narrow segment of the technology sector. This resilience in equities stands in stark contrast to the cautionary signals from fixed income and the volatility of the energy market.
Looking toward June, the sustainability of the rally depends on three critical factors: the stability of Brent crude below the $100 threshold, the continued fundamental delivery of the AI investment thesis and the ability of equity markets to navigate an increasingly restrictive yield environment.
We remain vigilant and continue to monitor events closely, most importantly, we ensure that portfolios remain well diversified and positioned to navigate periods of uncertainty while continuing to capture opportunities as markets evolve.
If you have any questions or concerns about your investments or your future plans, don’t hesitate to get in touch with your TPO Adviser or contact us centrally through our website.
This information in this article is correct as at 10/06/2026.
Arrange your free initial consultation
This market update is for general information only, does not constitute individual advice and should not be used to inform financial decisions. Investment returns are not guaranteed, and you may get back less than originally invested; past performance is not a guide to future returns.

Stocks & Shares ISAs to face 22% tax next year
Rachel Reeves is expected to bring in a 22 per cent tax charge on interest generated from cash held within stocks and shares ISAs , with the changes due to come into force next April.
From April 6, 2027, savers under 65 will see their cash Isa allowance reduced to £12,000, although the overall £20,000 Isa limit will still be available through a stocks and shares Isa.
The Chancellor first signaled the policy in last year’s Budget, presenting it as a measure designed to encourage greater investment in the UK and to prevent savers from using their stocks and shares ISA as surrogate cash ISA after the cash ISA allowance reduction. However, until now, few details had emerged about how the revised system would work in practice.
Now, as part of the new “anti-circumvention rules”, investors will pay a 22 per cent charge on interest earned from cash balances held in stocks and shares ISAs from April 2027.
The proposal echoes the Isa rules that existed before 2014, when cash interest inside stocks and shares ISAs attracted a 20 per cent charge. Under the updated regime, the levy would match the savings interest tax rate, which is set to rise to 22 per cent in April 2027.
HM Revenue & Customs (HMRC) had already indicated that interest on cash held in stocks and shares ISAs would become subject to a charge from that date, although it had not previously specified the rate that would apply.
What is an ISA?
An ISA, or ‘Individual Savings Account’, is a scheme that allows anybody to hold cash, shares and unit trusts free of tax on dividends, interest, and capital gains. Essentially, it’s a savings account that you don’t pay tax on.
A Stocks and Shares ISA is a tax-efficient investment account that allows you to put your money into a range of funds in various asset classes, with the goal of hopefully achieving better long-term returns than you might from a traditional savings account.
Unlike a Cash ISA, which simply protects your interest from tax, a Stocks and Shares ISA puts your money to work in the financial markets. This means you can invest in things like funds, shares and bonds, while still benefiting from the ISA’s tax-free account status (or ‘wrapper’).
You can save up to £20,000 each tax year across ISAs and receive tax-free interest payments, so when the value of your cash ISA increases, you get to keep all of it tax-free. However, it’s important to note that from April 2027, the annual allowance for the cash ISA specifically will be reduced to £12,000 for those under 65.
While there is a £20,000 allowance in place for how much you can put in a year, there is not a cap on how much you can accumulate in an ISA over a lifetime.
When choosing a style of investment to suit your needs, you may want to consider how long you plan to invest for and how much you would like your money to grow. It is also important to understand what movement in value you may or may not be happy with and any potential losses that may happen. That is why soliciting professional advice can be crucial for understanding how to take those first steps towards a secure financial future.
If you want to find out more, why not give us a call on 0333 323 9065 or book a free non-committal initial consultation with one of our chartered advisers to see how we can help.
Arrange your free initial consultation
This article is intended for general information only, it does not constitute individual advice and should not be used to inform financial decisions.
The Financial Conduct Authority (FCA) does not regulate cash or tax advice.
Investment returns are not guaranteed, and you may get back less than you originally invested. Past performance is not a guide to future returns.

Inflation drops to 2.8%... but can it last?
The rate of inflation in the UK has dropped more than anticipated to 2.8% in the year to April, according to the latest figures from the Office for National Statistics (ONS). This is a notable drop from the 3.3% figure in the year to March.
Inflation continued to ease even as fuel costs climbed in the wake of the Iran conflict.
Data from the ONS showed petrol averaged 156.8p per litre last month, marking its highest level since November 2022. Diesel prices also jumped by more than 30p in April, pushing the average cost up to 190p per litre, the highest recorded since July 2022.
According to the RAC, petrol prices have continued to rise in May, reaching a new peak of 158.52p per litre on Tuesday.
So why has inflation fallen this time, and will it stick?
According to the ONS, energy costs had fallen thanks to a combination of reduced wholesale prices and the government’s energy bill support measures introduced before the Iran conflict began.
But economists are warning that inflation is likely to be on the rise again soon, potentially hitting around 4% by the end of the year, with ongoing tensions in the Middle East continuing to drive up global prices.
It’s also important to note that it can often take about a year for food supply cost changes to truly be reflected in food prices in the UK, so there are likely to be some price shocks as the economy catches up to the supply chain issues caused by the conflict.
What is inflation and how is it measured?
Inflation is a measure of how the prices of goods and services have increased over time. Goods are tangible items sold to customers, such as food, while services are tasks performed for the benefit of recipients, such as a haircut. Generally, this increase is measured by considering the cost of things today compared to how much they cost a year ago. The average increase between these prices is demonstrated in the inflation rate.
Rising inflation directly affects the cost of living. For example, if the price of a bottle of milk is £1, and inflation is increasing by 5%, then your bottle of milk will cost you 5p more. Or, in other words, the spending power of your money has decreased by 5%.
Ideally, the Government wants to keep inflation low and stable. The general mandated target for the Bank of England is 2%.
Anything significantly above or below this target is thought to cause issues for the economy.
The cost of living surged in recent years, with inflation peaking at 11% in 2022 - way above the Bank of England's 2% target, partly due to the increase in energy prices following Russia's invasion of Ukraine.
While the rate has dropped, falling inflation does not mean the goods and services are coming down in price overall, it is just that they are rising at a slower pace.
Our chartered financial advisers are expert and unbiased, meaning that they can give whole of market advice, and so are best placed to give you a plan tailored exactly to your personal financial goals.
If you’d like to know more, request a free non-committal initial consultation with one of our team or give us a call on 0333 323 9065 and get in touch.
Arrange your free initial consultation
This article is intended for general information only, it does not constitute individual advice and should not be used to inform financial decisions.

Is property still a good investment?
Property can still be a good investment, but it is no longer the straightforward route to wealth it once appeared to be. If you are buying a rental property today, you are doing so in a market shaped by higher borrowing costs, tighter tax rules, larger upfront taxes and stronger tenant protections. Since 1 May 2026, section 21 no fault evictions have been removed for existing and new tenancies in England, meaning landlords now need a legal ground for possession under the Renters’ Rights Act framework.
That does not mean buy to let is finished as rental demand still remains strong in many areas, and property can still provide income and long term capital growth. The question is whether the return you keep after tax, costs, borrowing and risk is enough when compared with alternatives such as ISAs, pensions and diversified investment portfolios.
Arrange your free initial consultation
Is property still a good investment in 2026/7?
For some investors, yes. For many others, only with careful planning. The key difference today is that the headline rent is not the same as the real return. A gross rental yield may look attractive, but mortgage interest, tax, maintenance, insurance, letting costs, void periods and future capital gains tax can reduce what you actually keep.
The Bank of England Base Rate is currently 3.75%, and higher financing costs have changed the sums for landlords who rely on borrowing. At the same time, the Renters’ Rights Act has changed how landlords recover possession, while tax changes have reduced the benefit of using debt to invest. Property can still work, but even accidental landlords now need to treat it as a business and compared against other investments on an after tax basis.
Upfront costs you can’t ignore
The first challenge with property is that you need significant capital before you receive a penny of rent. Unlike an ISA or pension, where you can usually invest gradually, buy to let requires a large initial commitment. That money is tied to one asset, in one location, with high costs to buy and sell.
Deposit
Buy to let lenders usually require a larger deposit than residential mortgage lenders. A typical landlord may need at least 25% of the property value, and sometimes more depending on the expected rent, personal income and lender stress testing. A bigger deposit can improve cash flow, but it also means more of your money is concentrated in one investment.
Fees
You also need to allow for mortgage arrangement fees, valuation fees, legal fees, survey costs and letting agent costs. These can materially reduce the return in the first few years. If you are comparing property with a stocks and shares ISA or pension, it is important to include these setup costs rather than focusing only on the monthly rent.
Refurbishment
Many rental properties need work before they are let. That may be cosmetic, such as flooring and decoration, or more substantial, such as kitchens, bathrooms, heating systems and energy efficiency improvements. A property that looks profitable on paper can become far less attractive if it needs months of work before it generates income.
Ongoing costs
The running costs of buy to let are easy to underestimate. Maintenance is not optional. Boilers fail, roofs leak, appliances break and regulations change. A sensible landlord keeps cash aside for repairs rather than assuming every month of rent is profit.
Voids – or periods of time when the property is empty - also matter. Even in areas with high demand, there may be periods between tenants, or delays while work is completed. During that time, you may still have a mortgage, insurance, service charges, council tax and utilities to pay.
Insurance is another cost that needs to be factored in. Standard home insurance is not enough for a let property, so you will usually need specialist landlord insurance. Depending on the property, you may also need buildings cover, contents cover, rent guarantee protection and public liability cover.
How are rental profits taxed
If you own a rental property personally, rental profit is added to your other income and taxed through income tax. The major change many landlords already face is that mortgage interest can no longer be deducted in full before calculating taxable profit. Instead, unincorporated residential landlords receive finance cost relief as a tax credit.
A further change is also on the way. Following the Autumn Budget 2025, the government confirmed that separate tax rates for property income will apply from April 2027. From the 2027/28 tax year, property income will be taxed at 22% for basic rate taxpayers, 42% for higher rate taxpayers and 47% for additional rate taxpayers. Residential finance cost relief will also be calculated at the new property basic rate of 22%
This means landlords will face a higher tax charge on rental income from April 2027, particularly where profits are already being squeezed by higher mortgage costs, maintenance and other running expenses.
This can create a painful result for higher rate and additional rate taxpayers. You may pay tax on a profit figure that feels much higher than the cash profit you actually receive. For this reason, some landlords consider using a limited company, but that brings corporation tax, accountancy costs, mortgage differences and possible tax charges if transferring existing property. It needs personalised advice.
Capital Gains Tax when you sell
If the property rises in value and is not your main home, capital gains tax may be due when you sell. For 2026/27, the annual exempt amount for individuals is £3,000. Residential property gains are generally taxed at 18% for basic rate taxpayers and 24% for higher and additional rate taxpayers.
It is worth noting though that it is gains falling in the basic rate income tax band that are taxed at 18%. The balance is taxed at 24% (i.e. a 'basic rate income tax' payer won't necessarily pay 18% on all gains).
This is where property can look different from ISAs and pensions. A gain inside an ISA is free from capital gains tax. A pension can also grow largely free of capital gains tax and income tax within the pension wrapper. With property, tax can arise on the income each year and again on disposal.
Stamp Duty Land Tax: what the Autumn Budget changed
Stamp Duty Land Tax (SDLT) is one of the biggest upfront barriers for buy to let investors in England and Northern Ireland. From 31 October 2024, the higher rates for additional dwellings increased from 3% to 5% above standard residential SDLT rates. This applies where buying the property means you will own more than one residential property.
Buy-to-Let Stamp Duty Rates (effective from 1 April 2025):
| Up to £125,000 | 5% |
| £125,001 – £250,000 | 7% |
| £250,001 – £925,000 | 10% |
| £925,001 – £1.5 million | 15% |
| Above £1.5 million | 17% |
The above rates are chargeable on each portion of the property value e.g. the first £125,000 at 5%, next £125,000 at 7%, etc.
This change makes the first day of ownership more expensive. A landlord now starts further behind before rent, growth or tax planning can improve the position. When you compare property with investing through an ISA or pension, the SDLT cost should be treated as part of the investment hurdle.
Property vs ISAs & Pensions
Property has strengths. It can provide rental income, may rise in value and can be improved through active management. It can also be financed with a mortgage, which may magnify gains if values rise. The same leverage can magnify losses if prices fall or costs rise.
ISAs and pensions are usually more flexible from a tax planning perspective. The ISA allowance is currently £20,000 per tax year (although the cash element is dropping to £12,000 a year for the under 65s from 2027), and income and gains within an ISA are tax free. Pensions can offer tax relief on contributions, with the standard annual allowance at £60,000 for 2026/27 for most people, although this can be reduced for some higher earners or those who have already accessed pensions flexibly.
The trade-off is control and access. Property feels tangible, but it is illiquid. ISAs can usually be accessed more easily. Pensions are designed for retirement and have access restrictions, but they can be highly effective for long term wealth planning.
For ISAs and Pensions, it is important to note that past performance is not a guide to future returns, and investment returns are not guaranteed; you may get back less than you originally invested. There may also be costs involved in setting up and managing your investments
Estate planning and property: inheritance considerations
Property can create inheritance tax issues because it often increases the value of your estate while producing income that is taxed during your lifetime. The standard inheritance tax nil rate band is £325,000, and the residence nil rate band can add up to £175,000 when passing down you main residence to direct descendants, subject to the rules and tapering for larger estates. Buy to let property will not usually qualify for the residence nil rate band in the same way as your main home unless it has been lived in at some point as a main residence (but you can only choose one property to use against though, if more than one in estate).
This matters because a property portfolio may be valuable but illiquid. Your beneficiaries could inherit an inheritance tax liability without enough cash in the estate to pay it. They may need to sell property quickly, possibly at a poor time in the market. Lifetime gifting, trusts, insurance and pension planning may all be relevant, but each has its own rules and tax consequences.
Speak to an investment expert
Property can still have a place in your financial plan, but it should not be judged by rent alone. You need to compare it with the net return you might receive from ISAs, pensions and other investments, while also considering tax, access, diversification and inheritance planning.
A financial adviser can help you look beyond the property headline and decide whether buy to let fits your wider goals. The right answer may be to buy, hold, sell, restructure or invest elsewhere. What matters is that you make the decision with clear numbers, current tax rules and a plan for how the asset will support you and your family over time.
Arrange your free initial consultation
This article is intended for general information only, it does not constitute individual advice and should not be used to inform financial decisions.
The information is based upon our understanding of legislation, whether proposed or in force, and market practice at the time of writing. Levels, bases and reliefs from taxation may be subject to change.
The value of investments can go down as well as up, you may not get back what you originally invested. The FCA does not regulate tax, estate or cash flow planning.

Markets rebound despite energy supply crisis
April marked a sharp change in tone for global markets. After a difficult March dominated by geopolitical tension and concerns over slowing growth, investors returned to risk assets with renewed confidence. While uncertainty surrounding the Iran conflict remained unresolved, markets increasingly focused on resilience: strong corporate earnings, renewed momentum in artificial intelligence, and an economy that, for now, continues to absorb higher energy prices better than many feared.
Arrange your free initial consultation
Equities
The result was a broad rebound in global equities, led once again by the technology sector.
Following a challenging backdrop in March, global equities rebounded sharply last month as risk appetite strengthened and markets discounted ongoing geopolitical uncertainty. AI leadership reasserted itself after the technology sector experienced one of its weakest periods of relative performance in fifty years, with investors rotating back into hyperscalers (large scale providers of global data centres) and AI infrastructure.
This bolstered the tech-heavy U.S. market, which also benefited from its status as a net energy exporter insulating it from the Iran conflict and a robust earnings season where 84% of S&P 500 companies exceeded expectations.
Internationally, returns were largely a function of technology concentration. This favoured Asia Pacific ex-Japan, which is home to companies such as TSMC and Samsung; meanwhile, UK equities underperformed, driven by the weak performance of the consumer staples and utilities sectors, which lagged as investors favoured growth over defensive assets.
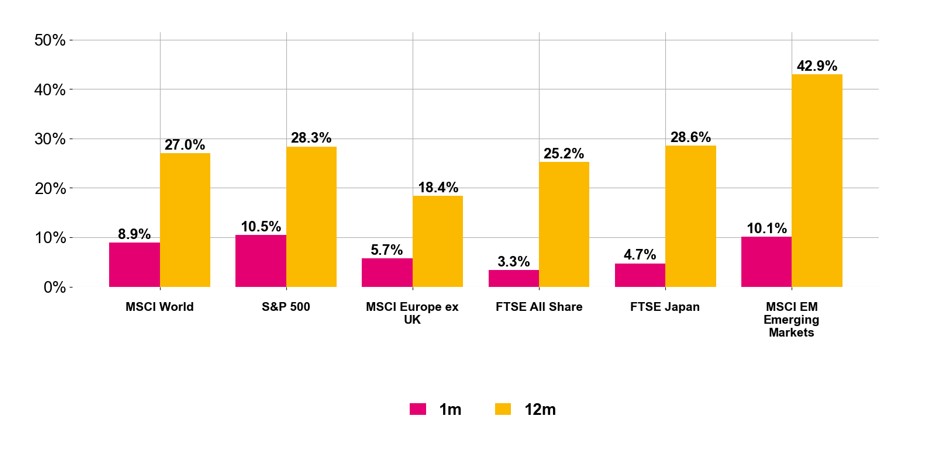
Figure 1. Equity market returns (May 2026, Source: Pacific Asset Management)
Fixed Income
Fixed income markets faced another challenging period as persistent hawkish central bank expectations kept government bond yields elevated through April. Policymakers broadly maintained their cautious stance, acknowledging that rising energy prices present upside risks to inflation and downside risks to economic growth. As a result, investors aggressively repriced the trajectory of monetary policy, with markets now factoring in potential rate hikes, a sharp reversal from the pre-conflict consensus of easing.
The path forward hinges on the duration of the Iran conflict; a protracted engagement increases the likelihood of a policy mistake, specifically the risk of raising rates into a weakening growth environment. While the fiscal profligacy of governments remains a structural headwind for bond markets, investors are increasingly pricing in higher inflation driven by energy costs. This can be seen in the US 30-year yield, which has moved in tandem with rising oil prices (see Figure 2.).
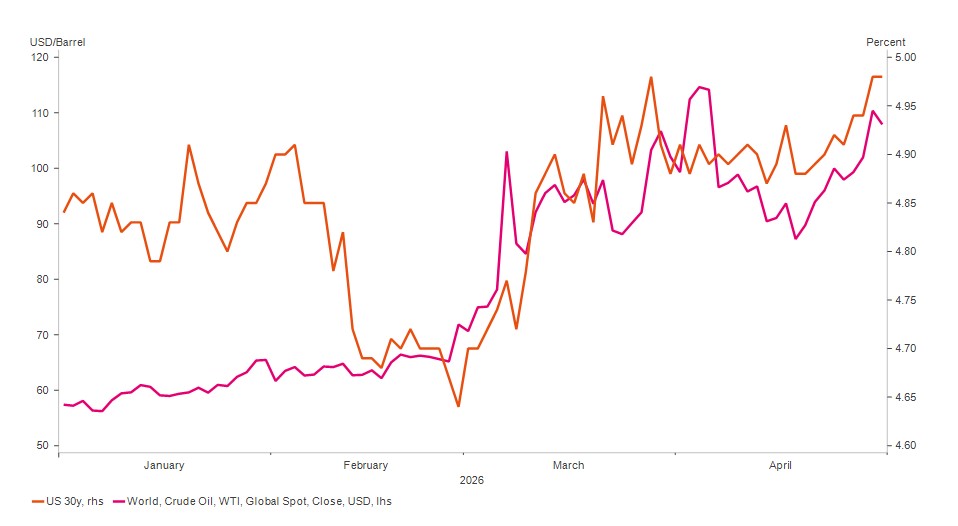
Figure 2. US 30yr yield and price of Crude Oil (May 2026, Source: Pacific Asset Management)
Oil & the 1970’s
As shown above, oil prices fluctuated significantly in April, retreating on ceasefire optimism before rebounding as negotiations reached an impasse. The disruption in the Strait of Hormuz has sharply tightened global supply, echoing the 1973 embargo and its legacy of entrenched inflation and stagnant growth.
This surge threatens to permeate supply chains and household budgets by driving up transportation and industrial input costs. While the modern economy is structurally more resilient than in the past, the current price deviation from historical norms remains stark. Crucially, however, historical context is required: on an inflation-adjusted basis, oil would need to surpass $170 per barrel to match the true severity of the 1970s crisis (Figure 3).
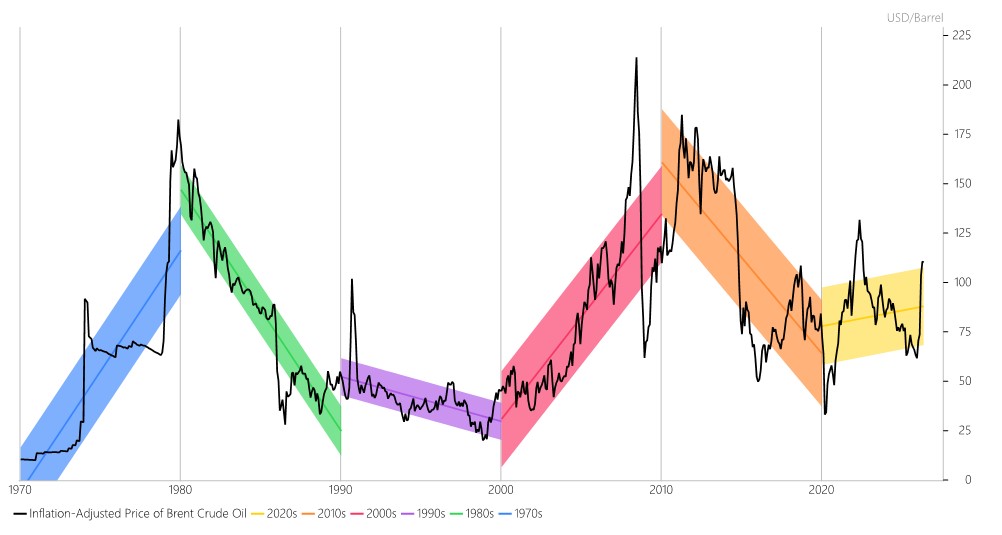
Figure 3. Crude Oil Inflation-Adjusted Price Trends by Decade (May 2026, Source: Pacific Asset Management)
The impact of oil price volatility is rarely isolated to a single sector; rather, it permeates the entire global economic landscape. Because energy is a foundational input for a vast array of goods and services, price swings exert a pervasive influence, simultaneously stoking inflationary pressures and acting as a ‘tax’ that can stifle consumer demand. Furthermore, the relationship between oil prices and asset returns is inherently non-linear. While moderate price increases might occasionally reflect healthy global growth, sudden supply-side shocks can trigger abrupt shifts in corporate profitability and investor sentiment. This complexity makes portfolio construction particularly challenging, as the economic transmission of energy costs often moves faster than traditional market hedges can adjust.
The Inflation Tipping Point and Asset Correlation
Historical market regimes demonstrate that the relationship between stocks and bonds is sensitive to the prevailing inflation environment. While there is no universal ‘magic number’, a clear shift typically occurs when inflation persists above the 2.5% to 3.0% range. Below this threshold, bonds often act as a reliable hedge against equity downturns, maintaining a negative correlation that protects portfolios. However, once inflation breaches this tipping point, as evidenced during the 1970s, the correlation frequently turns positive. In such environments, both asset classes tend to decline in tandem, as rising interest rates lead to higher yields as investors demand more compensation, causing bond prices to fall while simultaneously squeezing equity valuations. This shift effectively limits the portfolio of its traditional built-in protection.
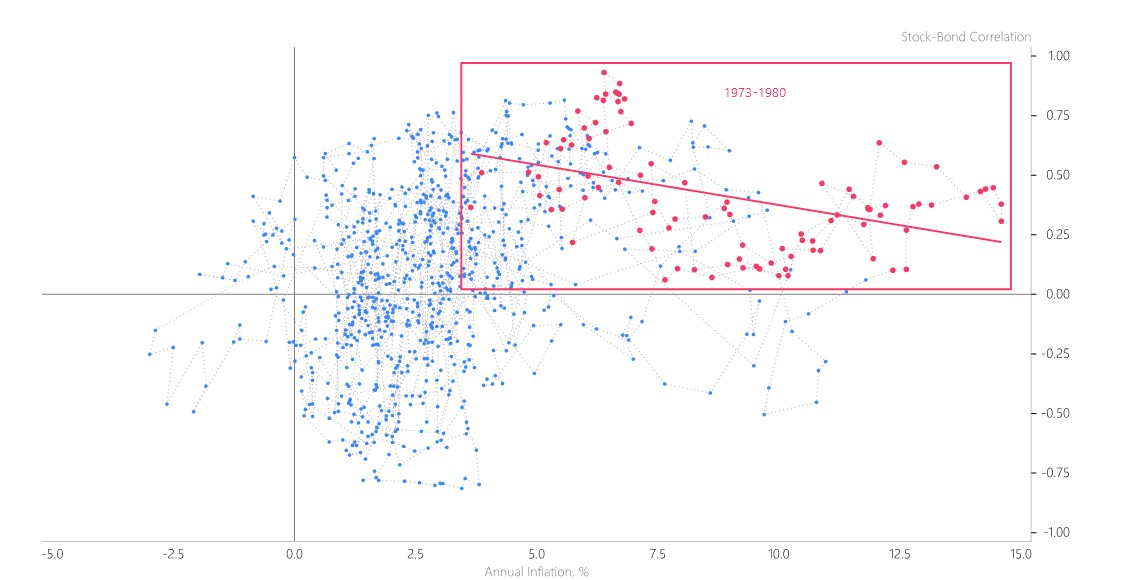
Figure 4. US Equity-Bond correlation (May 2026, Source: Pacific Asset Management)
In the current environment of geopolitical instability and energy-driven inflation, the traditional static 60/40 portfolio is facing a significant structural test. When the negative correlation between stocks and bonds breaks down, a passive, ‘set-and-forget’ approach no longer provides the defensive cushion investors expect.
Ultimately, we believe investors will be rewarded for being proactive; by recognising shifting market leadership and remaining agile, they can better capture emerging opportunities while navigating the complexities of this new market regime.
Most importantly, we ensure that portfolios remain well diversified and positioned to navigate periods of uncertainty while continuing to capture opportunities as markets evolve.
If you have any questions about your own portfolio or more general concerns in this period of heightened uncertainty, do contact your Adviser or contact us centrally through our website.
This information in this article is correct as at 14/05/2026.
Arrange your free initial consultation
This market update is for general information only, does not constitute individual advice and should not be used to inform financial decisions. Investment returns are not guaranteed, and you may get back less than originally invested; past performance is not a guide to future returns.

What is the threshold for higher rate tax?
Understanding when higher rate tax applies is an important part of making informed financial decisions. While tax can often feel complicated, the basic structure is more straightforward than many people expect. Knowing how much you can earn before moving into a higher band, what counts as taxable income and what allowances may be available, can help you plan more effectively and avoid surprises.
In the UK, Income Tax is charged at different rates depending on how much taxable income you receive. For many people, the key question is when earnings move beyond the basic rate and into the higher rate band. That threshold matters because it affects how much of your income you keep, how you approach pension contributions and how you think about wider financial planning.
Arrange your free initial consultation
Should I pay any Income Tax?
You only pay Income Tax on taxable income above the allowances available to you. For most people, that starts once income rises above the standard Personal Allowance of £12,570. If your earnings stay below that level, you will often have no Income Tax to pay, although there are exceptions depending on the type of income you receive and whether you qualify for any extra allowances.
It is also worth remembering that Income Tax is not charged on every type of money in the same way. Earnings from work, pension income, rental income and some savings income can all be taxed differently, and some people will have tax deducted through PAYE while others need to report income through Self-Assessment.
In practice, the question is not simply whether you earn money, but how much taxable income you have after any allowances and reliefs are taken into account.
When do you pay higher rate tax?
If you live in England, Wales or Northern Ireland, you start paying higher rate tax when your taxable income goes above £50,270. Income between £12,571 and £50,270 is taxed at the basic rate of 20 per cent, and income from £50,271 to £125,140 is taxed at 40 per cent. Above £125,140, the additional rate is 45 per cent. These are the current bands published by GOV.UK for the 2026 to 2027 tax year.
Scotland uses different Income Tax bands on earned income. There, the higher rate is 42 per cent and begins at £43,663 if you have the standard Personal Allowance, with an advanced rate of 45 per cent above £75,000 and a top rate of 48 per cent above £125,140. That means a Scottish taxpayer can move into higher rate tax sooner than someone elsewhere in the UK.
One detail that often catches people out is that crossing the higher rate threshold does not mean all of your income is taxed at 40 per cent. Only the part above the threshold is taxed at that rate. This is why a pay rise that takes you over the line is still usually beneficial, even if more of your income is taxed.
What is a Personal Allowance?
The Personal Allowance is the amount of income you can usually receive before paying Income Tax. For the 2026 to 2027 tax year, the standard figure is £12,570. For most employees and pensioners, this is the foundation of their tax calculation. It reduces the amount of income that is exposed to tax bands and helps determine when basic or higher rate tax starts to apply.
There is another important point here for higher earners. Once your adjusted net income goes above £100,000, your Personal Allowance is reduced by £1 for every £2 above that level. It falls to zero once income reaches £125,140. This creates a particularly harsh pinch point because you are not only paying higher rate tax, you are also losing part of your tax free allowance as income rises. This is where what’s known as the 60% tax trap kicks in, as it creates an effective 60% tax rate when taking income tax and reduced tax free allowances into consideration. Add in National Insurance and you’re paying a 62% effective rate.
What is Income Tax used for?
Income Tax is one of the main ways the government raises money to fund public services. HMRC states plainly that it collects the money that pays for the UK’s public services. GOV.UK also provides taxpayers with an annual summary showing how Income Tax and National Insurance contributions feed into government spending.
In broad terms, that revenue helps support areas such as health, education, welfare, transport, defence and day to day public administration. The Office for National Statistics also notes that taxes make up the majority of government income. So while Income Tax can feel like a deduction that disappears from your payslip, it remains one of the central pillars of how the state funds essential services.
How much Income Tax will I pay?
That depends on where you live in the UK and how much taxable income you have. In England, Wales and Northern Ireland, someone with taxable income of £60,000 and the standard Personal Allowance would pay no tax on the first £12,570, 20 per cent on the next £37,700 and 40 per cent on the remaining £9,730. That works out as £7,540 at basic rate and £3,892 at higher rate, for a total Income Tax bill of £11,432. The key point is that the higher rate only applies to the slice above £50,270. This calculation follows the current GOV.UK bands.
If you are in Scotland, the same salary can produce a different result because the bands are different. The tax system is not uniform across the UK, so using the right set of rates matters. This is especially relevant for people who are comparing job offers, approaching retirement, drawing income from multiple sources or trying to decide how much of a bonus to take as salary.
A further complication is that your tax bill can change if your Personal Allowance is reduced, if you receive taxable benefits, or if part of your income comes from dividends or savings. Income Tax is simple at the headline level, but once income sources multiply, the true figure can move quickly.
It is also worth understanding the order in which different types of income are taxed, as this can catch people out. Non savings income is taxed first. This includes earnings from employment, self employed profits, pension income and rental income. Savings income is taxed next, which includes things like interest from bank and building society accounts. Dividend income is taxed last. This matters because your non savings income uses up your Personal Allowance and tax bands before savings interest and dividends are taken into account, which can mean those later sources of income are taxed at a higher rate than expected.
For example, if someone in England has a salary of £45,000, savings interest of £3,000 and dividend income of £2,000, their salary is taxed first and uses up all of their Personal Allowance as well as most of the basic rate band. The savings interest then sits on top of that salary, and the dividend income sits on top of both. Even though none of the income sources looks especially large on its own, the order they are taxed in can push part of the interest or dividends into a higher band. That is why it is so important to look at your total income as a whole rather than viewing each source in isolation.
How to minimise the tax you pay
The starting point is to make full use of the allowances and reliefs that are already built into the system. Pension contributions can be particularly valuable because by paying your relief at source (so paying into a pension without the deduction of basic rate tax) this may increase your basic rate tax band which in turn can reduce the amount of income that will be taxed at the higher rate tax band. This can help you reduce the amount of tax you pay at the higher rate or preserve your Personal Allowance if income is above £100,000.
ISAs can also play an important role because returns within an ISA are sheltered from Income Tax and Capital Gains Tax. Salary sacrifice, where available, may improve tax efficiency too, depending on your circumstances. For couples, holding assets and drawing income in the most tax efficient name can also make a meaningful difference over time. None of this is about avoiding tax. It is about using the rules properly and planning ahead rather than reacting once the tax year has ended.
This is where financial planning becomes useful. The higher rate threshold is a point where decisions about pensions, remuneration, investment wrappers and income timing can start to have a much bigger impact. Knowing where the threshold sits is helpful. Structuring your finances around it is where the real value often lies.
If you want to find out more about minimising the amount of tax you might have to pay, you can request a free non-committal initial consultation with one of our team or give us a call on 0333 323 9065 and get in touch.
Arrange your free initial consultation
The Financial Conduct Authority (FCA) does not regulate cash flow planning or tax.
This article is intended for general information only, it does not constitute individual advice and should not be used to inform financial decisions.
A pension is a long-term investment not normally accessible until age 55 (57 from April 2028 unless the plan has a protected pension age).
The value of your investments (and any income from them) can go down as well as up which would have an impact on the level of pension benefits available.
The information contained in this article is based on our understanding of legislation, whether proposed or in force, and market practice at the time of writing. Levels, bases and reliefs from taxation may be subject to change.

Middle East oil crisis creates a slippery slope for markets
Performance in Q1 2026 followed two sharply contrasting trajectories – in sporting terms, it really was a game of two halves (or thirds, to be technically correct)!
The quarter began with equities extending their year-end rally through February, but this optimism was upended in March. The launch of attacks on Iran by U.S. and Israeli forces led to the effective shutdown of the Strait of Hormuz, a vital artery for global oil. This development triggered a spike in market volatility as investors re-priced assets against a backdrop of rising energy costs and heightened geopolitical risk.
Arrange your free initial consultation
Equities
Global equities experienced their worst monthly return since 2022, falling 6.8%, with markets most acutely exposed to energy prices, such as Japan and the broader Asian region, seeing the steepest declines.
European equities sharply sold off, as whilst less dependent on the Strait of Hormuz than Asian economies, they do remain vulnerable to price shocks and supply disruptions with close to 60% of European energy needing to be imported.
Performance across the UK equity landscape was split. Large-cap companies benefited from their international reach and the presence of major oil and gas producers, allowing them to outperform the broader market. In contrast, domestically focused small-cap equities underperformed, as their heightened sensitivity to the UK’s fragile economic outlook weighed on investor sentiment.
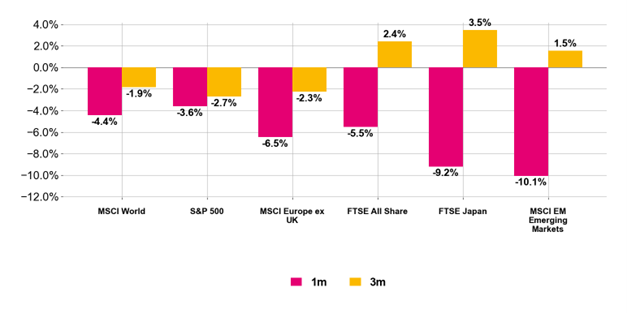
Figure 1. Equity market returns (April 2026, Source: Pacific Asset Management)
Fixed Income
Continuing a post-pandemic trend, government bonds failed to provide the traditional 'safe-haven' shelter investors had become accustomed to during the equity market downturn. This disappointment stemmed from a sharp reappraisal of interest rate trajectories. While developed market yields had been trending lower early in the year, the prospect of conflict-driven inflation in the Middle East abruptly shifted expectations, triggering a broad sell-off across US, UK, and European government bonds in March.
Prior to the geo political escalation, UK Gilts had led sovereign market performance as cooling price pressures fuelled hopes for imminent Bank of England rate cuts. However, the resulting energy shock left the UK - with its high dependence on natural gas - uniquely vulnerable to upside inflation risks. Consequently, the 10-year Gilt yield surged above 5%, marking its worst monthly performance since the 'mini-budget' volatility of 2022.
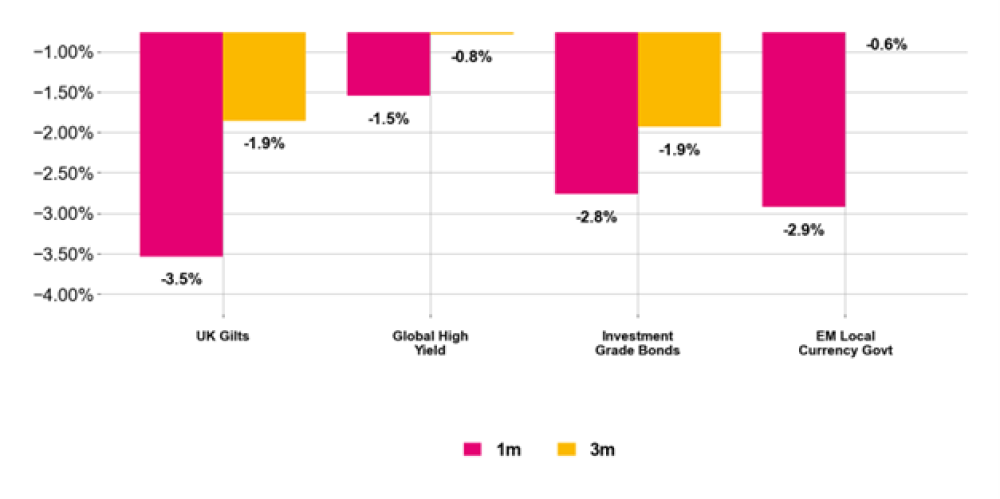
Figure 2. Fixed Income returns (April 2026, Source: Pacific Asset Management)
Commodities
Commodity markets experienced a historic monthly divergence in March, with the energy sector at the epicentre of the shock. Driven by the escalating Middle East conflict and the closure of the Strait of Hormuz, energy prices rallied sharply; Brent crude surpassed the $100-per-barrel threshold, marking its steepest monthly gain in four decades.
In stark contrast, the metals sector faced intense downward pressure. Following a sustained year-long rally, gold plummeted by more than 10%, marking its worst monthly performance since the 2008 financial crisis. This reversal occurred as investors pivoted toward a more hawkish central bank outlook, stripping gold of its safe-haven momentum. The correction likely reflected a wave of profit-taking and deleveraging, with gold and silver serving as primary sources of liquidity during a period of forced portfolio repositioning.
Although the current geopolitical shock has triggered significant volatility, historical precedents indicate that such episodes are typically short-lived in their market impact. We are closely evaluating the evolving consequences for global growth, inflation, and corporate earnings; however, we also recognise that periods of indiscriminate selling can create attractive entry points for disciplined investors.
At this juncture, we continue to advocate for a strategy of prudent risk management while remaining positioned to capitalise on market dislocations as they arise.
If you have any questions about your own portfolio or more general concerns in this period of heightened uncertainty, do contact your Adviser or more generally The Private Office team.
Arrange your free initial consultation
This article is intended for general information only, it does not constitute individual advice and should not be used to inform financial decisions.
Investment returns are not guaranteed, and you may get back less than originally invested; past performance is not a guide to future returns.