Skip to main content
May returns encourage investors to stay not go away
‘Sell in May and Go Away’ is a popularised investing strategy which recommends investors sell on the 1st May and re-buy on the 31st October.
The strategy has gone through various iterations but it is believed this was coined in 18th century Britain when aristocrats and bankers left the City for their summer holidays only to return on the day of the St. Leger Stakes.
Arrange your free initial consultation
The idea underpinning the strategy is that market liquidity tends to decline during the summer months, making markets more vulnerable to volatility. However, empirical evidence is mixed, as the S&P 500 has posted negative returns in only nine summers since 1988 (see Figure 1.).
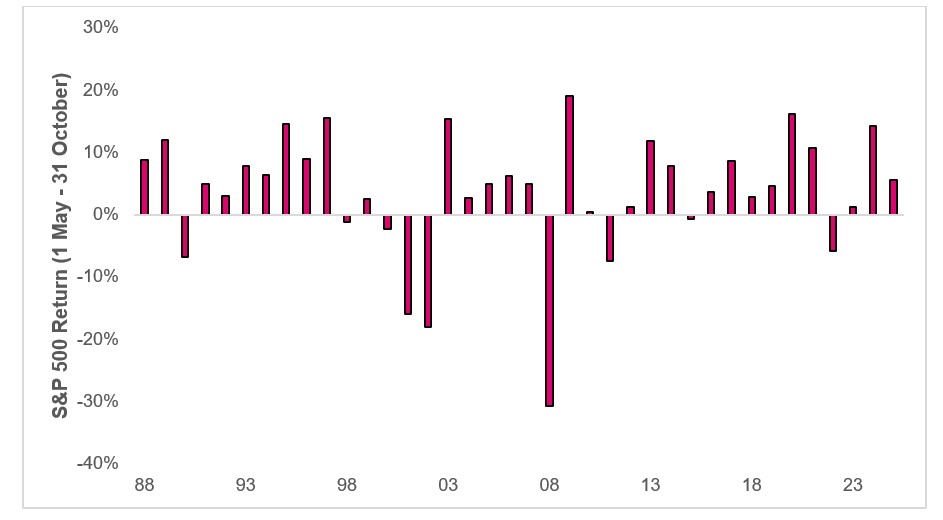 Figure 1. Returns of the S&P 500 between 1 May – 31 October (Source: FE Analytics, April 2025)
Had investors followed this strategy last month, they would have missed out on a 5.4% gain in the S&P 500. This was part of a broader rally in risk assets, driven by news of a trade deal between the US and China, which reduced recession fears and eased some of the uncertainty in markets (see Figure 2).
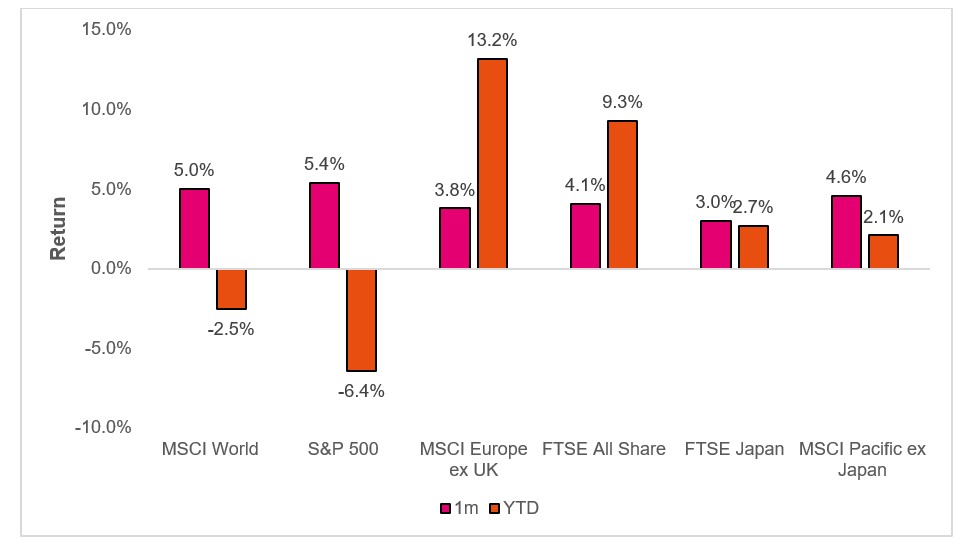
Figure 2. Regional equity returns (Source: FE Analytics, May 2025).
US equities in particular were supported by another round of strong earnings. US corporates defied expectations with year-on-year earnings growing 13% in Q1 and in a sense of déjà vu the Magnificent 7 led the way growing earnings 28%. Meanwhile the broader US equity market (the ‘S&P 493’) grew earnings 9.4% which is a marked increase from the 4.8% that was forecasted back in March.
It’s important to note that Q1 earnings were reported before the full impact of tariff-related uncertainty was felt in the markets. Although tariffs were mentioned in 89% of US earnings reports, we’ll need to wait for the next quarter’s results to properly assess their effect. That said, the current level of earnings growth indicates that US corporates entered this period from a position of strength.
Outside of the US we saw UK equities post another strong month with the FTSE All Share index up 4.1%. This follows improving economic data and the Bank of England cutting interest rates by 0.25% to 4.25%. Meanwhile European equities added to their strong year-to-date returns as cyclical sectors like technology rallied on falling trade tensions and the prospect of the German infrastructure bill which is likely to have benefits for broader Europe.
Whilst equities performed well it was another challenging period for bond investors as concerns around government fiscal largesse and spending policies were back in the spotlight.
The announcement of the ‘Big Beautiful Bill’ in the US which can be best described as ‘Front loaded tax cuts and back loaded spending cuts’ saw US Treasury yields rise with the 10yr yield climbing above 4.60%.
The US administration’s shift from fiscal prudence to growing out of debt is a laudable goal but history is not on their side and developed countries across the world have struggled to generate economic growth without the need of vast stimulus programs.
Since 2020 the US’s debt-to-GDP has grown from 100% to over 120%. In other words the level of debt in the economy is growing quicker than economic growth (see Figure 3.).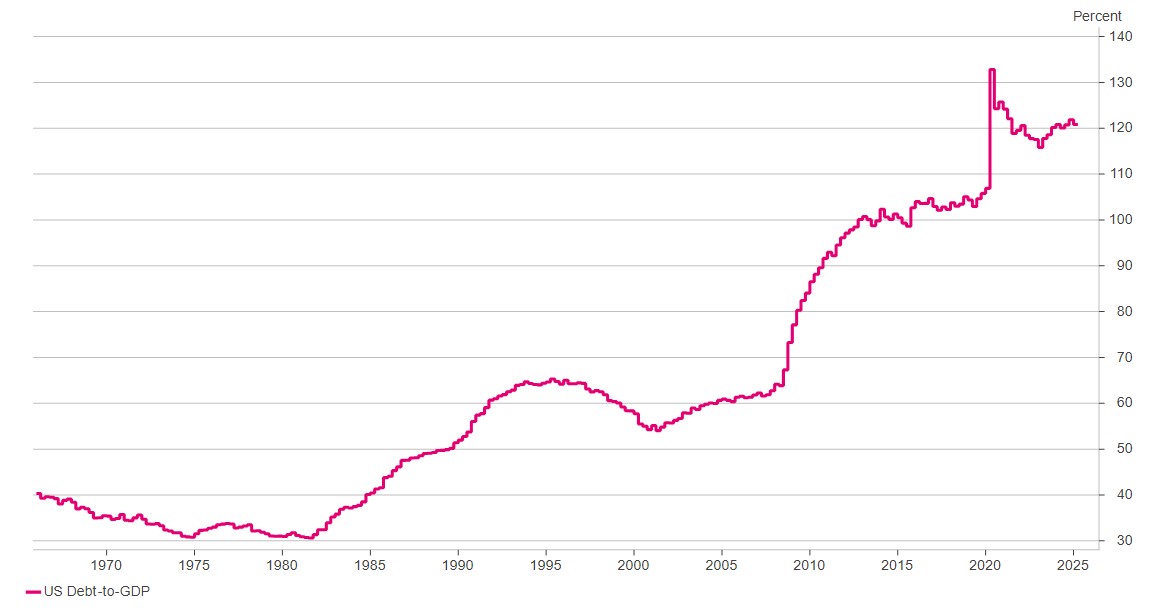
Figure 3. US Debt-to-GDP (Source: Macrobond, May 2025).
We also saw Moody’s downgrade the US’s credit rating (Aaa to Aa1) which whilst a largely symbolic move illustrates the level of pessimism there is towards the US’s current fiscal position.
Credit markets were more resilient as improving risk appetite saw High Yield Bonds outperform Investment Grade bonds. Investment grade bonds were broadly flat on the month, however we saw a continued narrowing in high yield spreads (the compensation one gets for investing in bonds with credit risk) with US High Yield spreads falling to 3.3% - the index was trading at 4.6% back in early April.
Looking ahead, attention will now turn to the 9th July when the pause on the reciprocal tariffs will end. We expect countries to try and lock in a trade deal with the US between now and early July. This should provide further clarity for investors and allow for the impact of tariffs to be accounted for.
In summary investors were rewarded for taking risk in May, as strong equity gains driven by solid earnings and easing trade tensions outpaced concerns over fiscal policy and rising yields. While risks remain, recent market resilience highlights the benefit of staying invested through uncertainty.
As ever, if you’ve any questions or concerns about your investments or your future plans, don’t hesitate to get in touch with your TPO adviser team.
Arrange your free initial consultation
The information in this article is correct as at 13/06/2025.
This market update is for general information only, does not constitute individual advice and should not be used to inform financial decisions. Investment returns are not guaranteed, and you may get back less than originally invested; past performance is not a guide to future returns.
Life stages that can derail your finances without the right advice
Managing your finances can often feel straightforward, particularly when it comes to day-to-day budgeting or saving for short-term goals. But some financial decisions carry long-term consequences that are far from simple. In these instances, the stakes are higher, the options more complex, and the implications far-reaching - not just for you, but for your family too. These are the moments when seeking professional financial advice is not just sensible but crucial.
Arrange your free initial consultation
Advice on estate planning
Gifting Property to Your Children:
One of the most common motivations for gifting property is to help children onto the housing ladder or to reduce the value of an estate for inheritance tax purposes. However, this seemingly generous act can trigger unexpected tax complications and financial risks if not handled carefully.
Transferring ownership of a property can have implications for capital gains tax, especially if it is not your main residence. When considering inheritance tax, if you gift a property that is worth more than your Nil Rate Band (NRB) or joint NRB (or joint owners, usually both parents) then if you pass away within 7 years, the beneficiary of the house is liable to pay the 40% inheritance on the value of the gift above the NRB. This provides complications to the beneficiary as they may be forced to sell the property or have to set up a regular arrangement with HMRC to pay the inheritance tax due.
In addition, should you continue to live in the property after gifting it, you may fall foul of the “gift with reservation” rules, which mean that HMRC could still treat the property as part of your estate for inheritance tax purposes.
Moreover, giving away significant assets could impact your financial security in later life. Once a property is legally transferred, you lose control over it. This can be detrimental to your later life planning such as paying for care costs. If your child were to go through divorce, bankruptcy, or pass away unexpectedly, that property could become part of a legal or financial settlement. These are difficult possibilities to consider, but failing to plan for them could create avoidable hardship.
Seeking financial advice can provide you with peace of mind when gifting away assets, ensuring that they are absolutely surplus to your requirements and allow you to plan appropriately.
Passing on wealth:
Estate planning goes far beyond writing a will. It involves a careful review of your assets, liabilities and how best to pass on wealth to future generations in a tax-efficient manner. Inheritance tax, currently charged at 40 per cent on estates over £325,000 per individual, can significantly reduce the value passed to your heirs if not planned for in advance. Also, for those passing down their main residence to direct descendants, an additional £175,000 Residence Nil Rate Bands (RNRB) per individual is available (on net estates valued up to £2 million), meaning up to £500,000 for an individual or £1 million for married couples/civil partners could be passed down free of inheritance tax.
A direct descendant is classified as your spouse/civil partner, children (adopted, fostered and stepchildren) and grandchildren.
From making use of available allowances and reliefs, to setting up trusts or using life insurance to cover tax liabilities, there are many tools available to reduce the impact of inheritance tax. Missteps can lead to unintended tax bills, loss of asset control, or disputes among beneficiaries.
Advice using equity release
Equity release has become an increasingly popular option for those seeking to unlock the value in their home without selling it. Whether you're looking to supplement your pension income, fund home improvements, or gift money to family, releasing equity can be appealing. It’s even an option for some with large estates looking to lower the value of their estate for inheritance tax purposes. However, it's not a decision to take lightly.
Equity release products, such as lifetime mortgages, can have long-term financial consequences. While you do not need to make monthly repayments, interest is typically rolled up and added to the loan, which can significantly reduce the value of your estate over time. If not for the intended purpose of lowering your estate, this may impact what you are able to leave behind for your loved ones and could also affect your eligibility for means-tested benefits. In order to have maximum benefit from a lifetime mortgage for inheritance tax (IHT) your estate needs to be more than the sum of the NRB and RNRB.
It is essential to assess your overall financial situation to decide whether equity release is the right fit, or if there are more appropriate alternatives available.
Advice on planning for retirement and managing pensions
Pension planning is another key area where financial advice can make a substantial difference. For many, pensions represent the most significant savings pot outside of property, yet they are often misunderstood or neglected. As retirement approaches, knowing how to draw down your pension in the most tax-efficient way becomes increasingly important.
There are several options available when accessing your pension, including taking a tax free lump sum, setting up drawdown arrangements, or purchasing an annuity. Each comes with its own set of implications for tax, investment performance, and long-term income security. Without clear guidance, it’s easy to make choices that could result in paying more tax than necessary or even running out of money later in life.
Financial advice is particularly important when consolidating multiple pensions, especially if you are considering transferring your defined benefit schemes to a drawdown arrangement or the current scheme provides guaranteed income features such a Guaranteed Minimum Pension (GMP) benefit. It’s vital to evaluate the advantages and disadvantages of consolidation and help you build a sustainable income plan for your retirement years.
Advice on understanding the value of cash in retirement
In retirement planning, maintaining a cash reserve is crucial to safeguard your financial future, especially when facing market volatility. This strategy helps manage ‘sequencing risk’.
Sequencing risk is the risk of receiving lower or negative returns early on in your retirement due to market downturns when you begin drawing an income from your investments. The negative impacts of sequencing risk can have the effect of eroding your savings at a faster rate and can potentially increase the chances of running out of money.
Holding a cash reserve equivalent to one to three years' worth of living expenses provides a buffer during market downturns. Instead of selling investments at a loss, you can draw from your cash reserves, allowing your investment portfolio time to recover. This approach helps preserve the longevity of your retirement savings.
Making the most of what you have
Life is full of financial crossroads - some expected, others less so. Selling a business, receiving an inheritance, going through a divorce, or receiving a medical diagnosis can all bring sudden and significant changes. In times like these, a financial adviser can act as both a guide and a steady hand, helping you navigate uncertainty with confidence.
Even if you’re not facing a major life event, periodic check-ins with a financial adviser can help ensure you remain on track toward your goals. Whether you're planning for retirement, helping your children financially, or simply looking to make smarter investment decisions, the right advice can help you make the most of what you have.
At its core, financial planning is not just about numbers. It’s about peace of mind, protecting your loved ones, and creating the future you want to see. For the decisions that matter most, getting expert advice can be one of the most valuable investments you make.
Arrange your free initial consultation
This article is intended for general information only, it does not constitute individual advice and should not be used to inform financial decisions.
Levels, bases and reliefs from taxation may be subject to change.
Using equity on your home will affect the amount you are able to leave as an inheritance. Any means tested state benefits (both current and future) may be affected by any equity released. This is a lifetime mortgage. To understand the features and risks, ask for a personalised illustration.
A pension is a long-term investment. The fund value may fluctuate and can go down. Your eventual income may depend on the size of the fund at retirement, future interest rates and tax legislation.
The Financial Conduct Authority (FCA) do not regulate estate, cash flow planning, will writing or tax and trust advice.

Reasons for optimism: Trump shaken as US bond markets stirred!
April 29th marked President Trump's first 100 days in office. His early April ‘Liberation Day’ announcement signalled a major shift in U.S. trade policy. A subsequent 90-day pause (except to China) offered brief relief, but ongoing uncertainty continues to weigh on markets.
Arrange your free initial consultation
Part of the uncertainty relates to the fact that trade deals are not typically completed within 90 days. If we look back at historic trade deals that the US have negotiated it has taken on average 18 months to agree to a deal and then a further 45 months to implement (see Figure 1.).
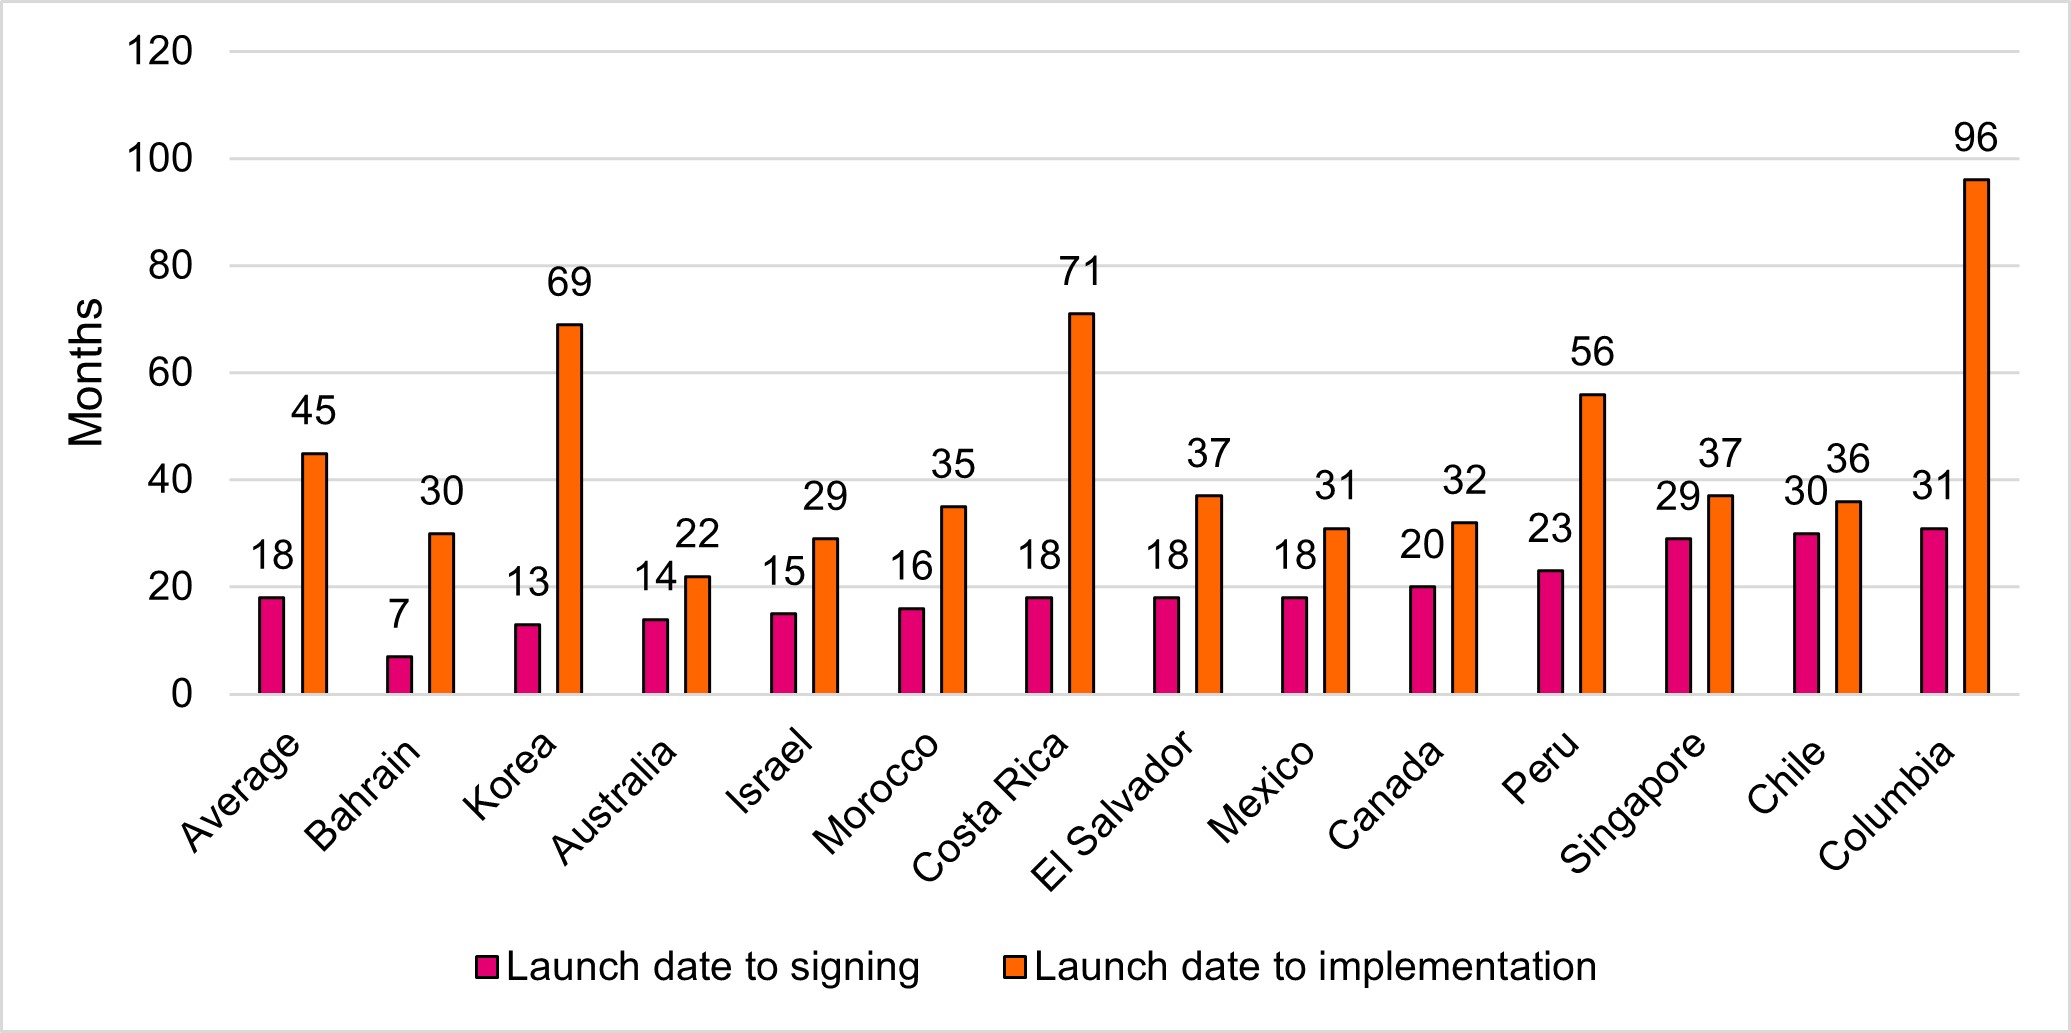
Figure 1. US Historic trade deals (Source: Apollo, April 2025)
In equity markets, we saw the volatility of US equities spike with the ‘Volatility Index’ (VIX) reach a level not seen since the onset of the COVID-19 pandemic, as investors looked to appraise what US trade policy means for the outlook on global growth and inflation.
Against this backdrop, equity markets were challenged, with US equities struggling and the S&P 500 down over 4.3% (in sterling terms) last month. This means President Trump has the unenviable claim of being one of the few post-war modern Presidents to have the S&P 500 fall during their first 100 days and is the worst return since Nixon’s second term back in 1973.
Investors though were once again rewarded for being diversified and looking beyond the US. After a volatile start to the month, European equities rallied, led by Germany on the prospect of increased fiscal spending and Spain, whose economy is less exposed to US trade policies. Likewise, UK mid-cap stocks - benefiting from their domestic focus and reduced vulnerability to US tariffs - rose 2.1% (see Figure 2.).

Figure 2: April 2025: Regional Equity Returns in sterling (Source: FE Analytics)
Fixed income was not immune to the volatility, as we saw the US 10-year bond yield experience its largest weekly rise since 2001, climbing to 4.6% before retracing to 4.2% by month-end (Bond yields rise as prices fall). It is widely believed that this caused President Trump to walk back his tariff policy and implement the pause, given that he and his administration are seeking to lower yields (and the cost of Government debt) in the US.
In this backdrop we saw the price of German Government bonds increase as the spread (compensation for risk) increased between German and US bonds. Meanwhile UK Gilts rallied in April as investors expect the Bank of England to be more aggressive in cutting rates following the continued weakening in the labour market and the announcement that inflation in the UK fell from 2.8% to 2.6% in March.
In commodities, we saw the price of oil collapse 18% and trade at levels not seen since 2021. This followed the news that eight countries who form part of OPEC+, agreed to increase output of oil production at a time when investors are becoming increasingly concerned about a recession which could hamper demand.
Gold, however, reached a new high hitting $3,500 for the first time. This continued demand for gold reflects a confluence of several economic, political and financial factors.
Gold has in the past performed well during periods of geopolitical uncertainty, and ongoing global tensions have once again caused investors to view the precious metal as a ‘safe-haven’ asset. In addition to geopolitical uncertainty, the potential inflationary impact of new US tariffs has boosted gold prices, with investors hedging against the falling purchasing power of currencies such as the US Dollar.
Falling interest rates has also supported the price of gold as the asset does not pay any interest or dividends meaning the opportunity cost of holding gold is smaller. Finally Central Banks such as China and India have significantly increased their purchases of gold as countries shift away from the US Dollar and look to reduce the reliance on the US.
Looking ahead we continue to see a notable distinction between sentiment and ‘hard’ data.
Sentiment indicators, such as surveys - which by their nature are forward looking - continue to trend down, with US consumer confidence declining five consecutive months in a row and at a level not seen since the onset of the COVID-19 pandemic.
Conversely, April’s US jobs report showed 177,000 jobs added—surpassing the forecast of 138,000—while 76% of companies reporting quarterly earnings beating expectations. This suggests that the economy is more robust than sentiment indicators would initially lead us to believe.
On the tariff front, we are beginning to see an impact with a slowdown in activity at US ports and air freight as China, the world’s largest exporter, continues to face tariffs. We are all well aware of how interconnected the global supply chain is following the COVID-19 pandemic and the longer tariff uncertainty continues the more pronounced the issue will be.
We’re cognisant that we are in a transition period, where there’s a lot of uncertainty about the data currently being reported, and this is likely to contribute to ongoing market volatility. With that said, we continue to see a broadening opportunity set for investors, and in the absence of a clear direction, being well diversified remains the best course of action.
As ever, if you’ve any questions or concerns about your investments or your future plans, don’t hesitate to get in touch with your TPO adviser team.
Arrange your free initial consultation
The information in this article is correct as at 16/05/2025.
This market update is for general information only, does not constitute individual advice and should not be used to inform financial decisions. Investment returns are not guaranteed, and you may get back less than originally invested; past performance is not a guide to future returns.

What a base rate cut could mean for your finances
Following the latest Bank of England base rate cut on 8th May of 0.25%, to 4.25%, many households and investors are wondering what the implications might be for their financial plans. And if the forecasts are to be believed, it won’t be the last one. While that might sound like good news for borrowers, it’s not such a rosy picture for savers. And for those with investments, pensions or mortgages, now could be the right time to give your finances a once-over.
Arrange your free initial consultation
Good news for borrowers – not so great for savers
For savers, the prospect of a lower base rate is generally unwelcome. Interest paid on savings accounts typically tracks the base rate to some extent, and we had already seen a downturn in fixed-term savings rates, in anticipation of the base rate decision. Variable rates are likely to follow suit now the rate cut has happened.
Providers often anticipate base rate cuts and adjust their offerings accordingly, meaning the window to secure attractive rates may be closing. So if you’ve been toying with the idea of locking in a fixed rate, you may want to get on with it. There’s a decent chance that what’s on offer now won’t be around much longer, and holding off could mean settling for less.
Take a look at our Best Buy tables to see the best rates available.
Investors: time to get your money working again?
Over the last couple of years, rising interest rates made cash a pretty comfortable place to sit. But if those rates are now heading south, we expect more people to look again at the stock market, to stay ahead of inflation and keep their money working harder.
From a broader investment standpoint, lower interest rates can be a boost to asset prices as borrowing becomes cheaper, for individuals and businesses, and the returns from cash become less attractive. That often supports growth in certain sectors and can offer opportunities for investors who know where to look.
For those who don’t know where to look, the investment experts at TPO can help. We take this kind of market insight into account when reviewing and managing client portfolios - helping investors stay aligned with their goals, even as economic conditions shift.
That said, keeping enough cash on hand for short-term needs is still vital - maintaining a sensible cash buffer remains important to provide flexibility and peace of mind during periods of market volatility. It means you’re not forced to sell investments during market dips.
Thinking about an annuity? Timing matters
If you’re nearing retirement and considering buying an annuity, the base rate change is something to pay close attention to. Falling interest rates tend to drag annuity rates down with them, meaning the income you can secure for life may end up being lower than it was just a few weeks ago. And with annuities enjoying something of a resurgence recently, it’s not just about whether you buy one – it’s also about when you do and how you go about it. The key here is not to take the first offer from your pension provider. There are often better deals available elsewhere, particularly for those with any health issues - even minor ones can make a difference.
Deciding whether an annuity is the right option is not always straightforward, and making well-informed choices in retirement is essential. This is an area where professional advice can be invaluable.
Mortgage holders could benefit - but make the most of it
Mortgage holders may view a base rate cut more favourably. Those on variable rate deals or trackers will likely see their monthly payments fall, while those due to remortgage could benefit from lower rates than might otherwise have been available.
But don’t just enjoy the lower cost and leave it at that. If your mortgage is more affordable, why not consider overpaying a little each month (if your lender allows) or using the extra cash to top up your pension or ISA? It’s all about making your money stretch further while the opportunity’s there, to make your future financial position healthier.
For many, the value of impartial, expert advice cannot be overstated. Whether you are planning for retirement, managing investments or looking to optimise your savings, a tailored financial plan can offer both clarity and confidence.
If you’re unsure how the recent base rate decision might affect your financial plans, or if you simply want to make sure you’re on the right path, now may be the ideal time to get in touch.
Arrange your free initial consultation
This article is intended for general information only, it does not constitute individual advice and should not be used to inform financial decisions.
Investment returns are not guaranteed, and you may get back less than you originally invested. Past performance is not a guide to future returns.
The Financial Conduct Authority (FCA) does not regulate cash flow planning or tax.

A new trade era: market volatility after ‘Liberation Day’
It is quite remarkable what can happen over a 90 day period. Entering the year investors were optimistic that pro-growth policies in the US and the prospect of interest rate cuts would support global growth and drive the price of risk assets higher.
Arrange your free initial consultation
Trepidation emerged on the 20th January with the inauguration of President Trump and the promotion of what he and his administration considered ‘America First’ policies. Despite suggestions that this would be transitory, the initial tariffs on the imports of goods from Canada, Mexico and China proved enough to shake US equity markets. After reaching an all-time high in late February, the S&P 500 would end the quarter down 4.1%.
This uncertainty saw countries across the world reappraise their relationship with the US and question whether it would continue to be the global steward.
Nowhere was this more notable than in Europe, where we saw the announcement of significant fiscal packages, including an €800bn commitment from the European Commission to develop the region’s defence capabilities. More seismically, Germany – a country which typically has forgone mass fiscal programs – announced a €500bn infrastructure plan.
Already benefitting from a combination of cheap valuations and improving investor sentiment, this announcement saw European equities climb higher in February as US equities fell.
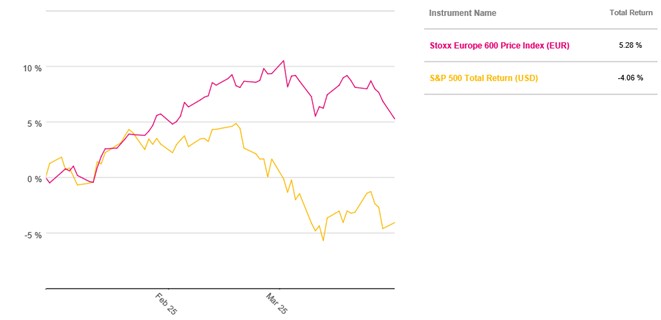
Figure 1: Outperformance of European Equities vs US Equities in Q1 (Source: Pacific Asset Management)
This proved a challenging period for investors with a relatively large allocation to US equities. For example if we take a typical global equity index portfolio, where each country is allocated a weight based on its market capitalisation (size of equity market), then you can see that the allocation to US equites would be more than 70% (see Figure 2.).

Figure 2: MSCI World Global Equity Allocation (Source: MSCI)
This, of course, would have previously been a highly successful strategy (‘buying the market’) because post 2008 in the era of cheap credit and increased liquidity, US equities only failed to outperform European equities on just four occasions (see Figure 3.).
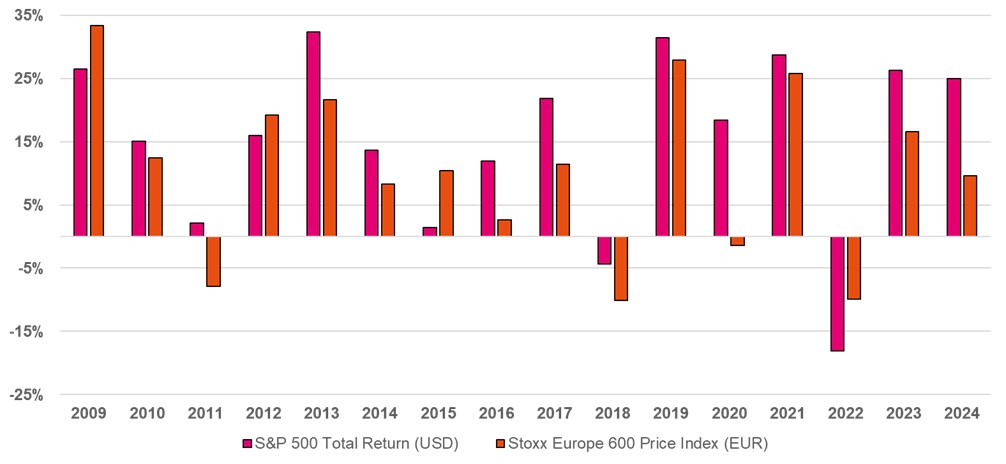
Figure 3: US equities vs European Equities 2009-2024 (Source: Pacific Asset Management)
These strategies do well when the status quo remains and there are no structural changes to the world order. However the rule book of global trade appears to have changed and rather than being a short lived measure, US tariff policy appears to be an entrenched position heralded by President Trump’s so-called “Liberation Day”.
President Trump declared the 2nd of April as Liberation Day, which signalled a seismic shift in US trade policy. This saw the instigation of a 10% base tariff for every country (regardless of the trade position with the US) along with reciprocal tariffs which looked to target those countries which were considered to have been taking advantage of the US either through large trade imbalances or applying high tariffs to the import of US products.
These tariff rates were above market participants forecasts – the full list can be seen below:
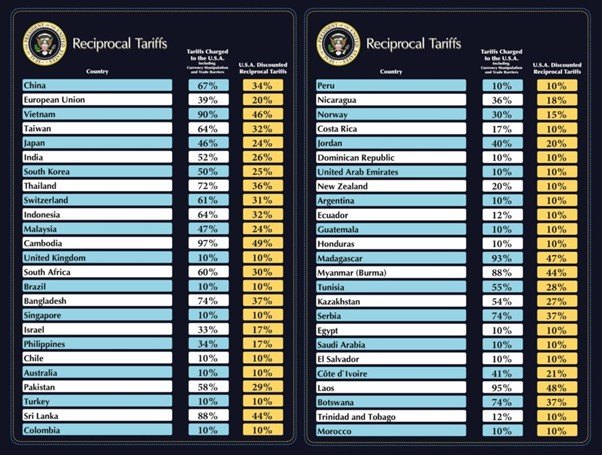
Figure 4: New US tariff rates (Source: GMK Centre, 2025)
The introduction of Tariffs was not a surprise, but the magnitude was. The effective US tariff rate is now in excess of 20%. This is greater than the tariffs imposed by the US under the ill-fated ‘Smoot-Hawley’ act in 1930 and you would have to go back to the early 1900’s to see a comparable figure.
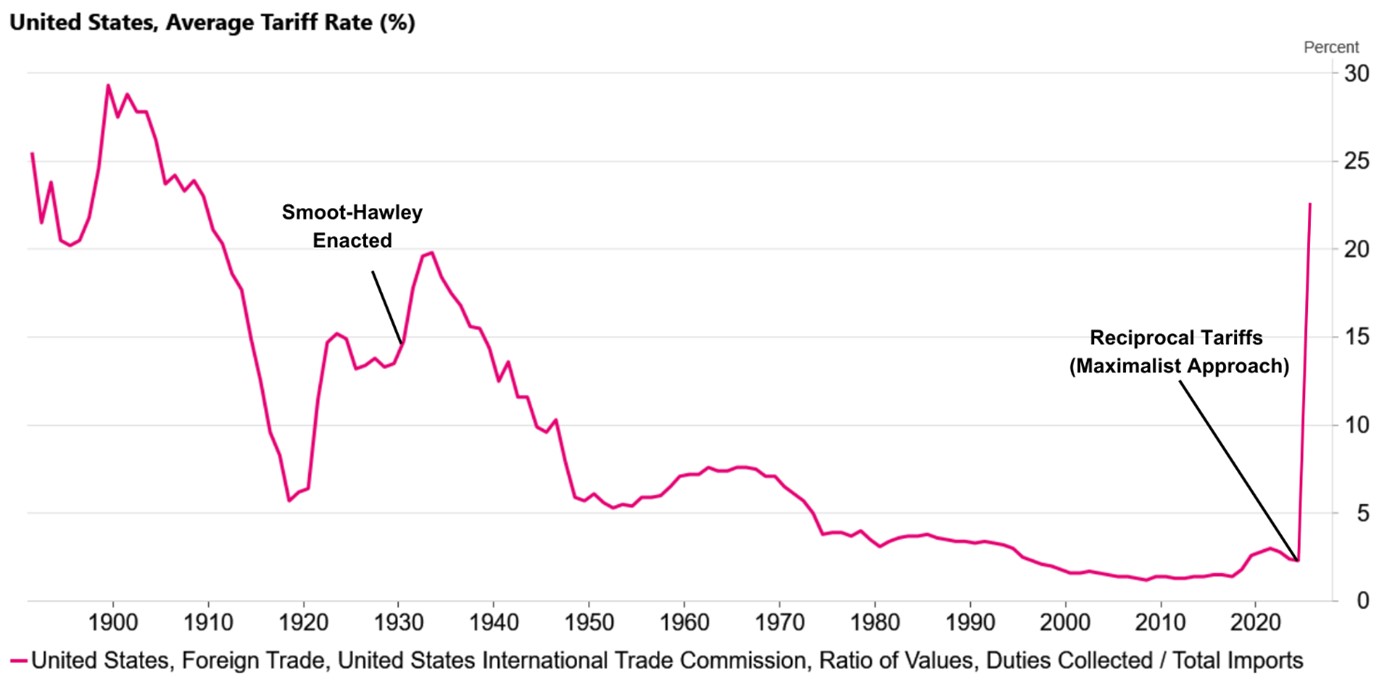
Figure 5: Effective US tariff rates (Source: US International Trade Commission, Macrobond)
At this stage it seems investors are still in reaction mode to the announcement and it will take time for markets to fully assess the impact. We’re also cognisant that this is an evolving situation, so do expect volatility (and uncertainty) to remain elevated.
At the time of writing we’ve just seen President Trump offer a 90-day pause on tariffs for countries that were willing to negotiate with the US. China’s ‘retaliation’ of an 84% tariff on US products saw its tariff rate increase to 125%. Time will tell whether these are negotiation tactics and whether the two sides will come to the table but the situation continues to be fluid.
Overall, in our view this worsens the growth and inflation mix for major economies. However the backdrop prior to the announcement has been characterised by strong earnings growth, a robust consumer and low leverage in both the consumer and private sector. It is rare that a recession is caused by government policy error, but this announcement has increased the odds of recession, whilst still not being our base case.
We appreciate this is an uncertain time for clients and such volatility can be unsettling. However, we have experienced similar volatility before and it is the nature of long-term investment that, on the path to long-term growth, periods such as this will be encountered. We are maintaining real time daily monitoring of all client portfolios. Should you have any concerns or questions, do contact your TPO Adviser.
Arrange your free initial consultation
The information in this article is correct as at 11/04/2025.
This market update is for general information only, does not constitute individual advice and should not be used to inform financial decisions. Investment returns are not guaranteed, and you may get back less than originally invested; past performance is not a guide to future returns.
Do you pay tax on investment income and gains?
You may have to pay income tax on investment income generated from your UK investments. The tax rate on your investment income will vary depending on the type of income you receive and the type of investment product you receive it from. Investment income, when liable to income tax, will count towards your total UK income when calculating your income tax liability in a given tax year. Examples of investment income include dividends or interest payments received from investments.
Arrange your free initial consultation
You may also be liable to tax on capital gains you make on your investments, i.e. the difference between the price you sell an investment for above the price paid for that investment. Any capital gain that breaches your annual exemption (currently £3000) may be liable to Capital Gains Tax (CGT). CGT is payable on stocks and shares, which can either be held directly or within an unwrapped portfolio, sometimes referred to as a General Investment Account (GIA) or Share Account.
Although most people may not think of their pension as an investment, pension funds have the ability to be invested in the stock market the same way as any other investment. Pensions are a tax-efficient way of saving for retirement as the money within your pension grows free of any income tax on income and CGT on capital gains. However, it is worth noting that any income you take from your pension (in excess of the 25% tax-free amount – subject to protection and limits) will be taxed at the marginal rate of income tax.
Do you pay tax on stocks and shares?
Yes, you do pay tax on stocks and shares in the UK, although whether or not you owe tax will depend on your individual circumstances and the type of account in which you hold them. If you hold shares directly in a trading account or a general investment account, any profits you make when you sell them will be subject to capital gains tax above your annual tax-free allowance. Additionally, any income you receive from those shares, such as dividends, will also be liable to income tax if they exceed the relevant allowances. However, if your shares are held within a tax wrapper like a stocks and shares ISA, you will not have to pay any income tax or capital gains tax on the dividends and profits you receive.
When do you pay tax on investments?
Tax on investments applies when income or gains exceed the tax-free or tax-free deferred allowances set by HMRC. You will generally have to pay tax on investment income (such as dividends or interest) if it exceeds the relevant personal, savings, or dividend allowances. Similarly, capital gains tax is payable when profits from the sale of certain investments exceed the annual CGT allowance.
Taxes on investments are assessed each tax year (6th April to 5th April the following year). If your investment income or capital gains exceed the relevant thresholds, you may need to report them through Self-Assessment and pay any tax owed by 31st January following the end of the tax year.
How much is tax on investment income and gains?
Tax on investment income and capital gains come at different rates, depending on the type of income you receive and the type of capital gains made. Most rates of tax on investment income and capital gains are dependent on the individual’s marginal rate of income tax. Your marginal rate of income tax is the tax rate you would pay on your next pound of income. An individual’s marginal rate of income tax can be calculated by adding together all relevant total UK earnings for a tax year and then seeing which tax bracket they fit into.
Dividend income (in excess of the tax-free allowance) is taxed at the dividend rate of income tax. This is 8.75% for basic rate taxpayers, 33.75% for higher rate taxpayers, and 39.35% for additional rate taxpayers.
Typically, all other sources of investment income, including interest payments, are taxed at the same rates as earned income. These rates are 20% for a basic rate taxpayer, 40% for a higher rate taxpayer, and 45% for an additional rate taxpayer.
The rate of CGT for capital gains on investments is 18% for basic rate taxpayers and 24% for higher and additional rate taxpayers.
For basic rate taxpayers, if the gain, when added on top of all other sources of income, pushes you into the higher rate band, the part that falls within the higher rate band will be subject to the higher rate of CGT. These rates are also applicable for capital gains on residential property. CGT is typically not payable on any increase in value of your main residence from the point of purchase until when sold.
How to reduce taxes on investment income and gains
There are various allowances that allow you to receive investment income and make capital gains on your investments without paying tax of any kind. Above these ‘thresholds’ you will pay the tax rates outlined above on investment income and capital gains.
- Capital Gains Tax allowance: An individual can make £3,000 worth of capital gains within a tax year without paying any CGT. If total capital gains equate to more than this allowance, you pay CGT on the difference between the total gain value and the allowance. If you generate a capital loss in any given tax year (i.e. investments are sold for less than they are bought for), you can use these losses to offset potential gains in future tax years provided the loss has been registered within 4 years.
- Personal allowance: the personal allowance is how much income from all sources one can receive in a tax year before they are subject to income tax. Currently the personal allowance is £12,570 per tax year.
- Starting rate for savings: If your taxable non-savings income is below £17,570 for the tax year, you may also receive up to £5,000 of interest from investments and not have to pay tax on it. This allowance is reduced by £1 for every £1 of non-savings income above the personal allowance.
- Personal savings allowance: this is an annual tax-free allowance that protects interest payments from tax. The allowance you get depends on what rate of tax you pay. Basic rate taxpayers have an allowance of £1,000 and higher rate taxpayers have an allowance of £500. Additional rate taxpayers do not receive an allowance.
- Dividend allowance: the dividend allowance allows you to receive dividends of £500 per tax year before you start paying tax. Above the allowance, the dividend rates of income tax, highlighted above, apply to any dividend income.
Tax-free savings and investments
There are several tax-efficient savings and investment options available to help minimize tax liabilities on income and capital gains.
Cash ISAs
A Cash ISA (Individual Savings Account) allows you to save money without paying tax on the interest earned. You can contribute up to £20,000 per tax year into a Cash ISA or split the allowance between the multiple ISAs that are available, and all interest is tax-free. This is a good option for those looking to save without risk, as Cash ISAs work similarly to traditional savings accounts.
Stocks & Shares ISAs
A Stocks & Shares ISA enables you to invest in a range of assets such as shares, bonds, and funds without paying tax on dividends, interest, or capital gains. Just like Cash ISAs, you can invest up to £20,000 per tax year, or split the allowance between the multiple ISAs available, and any gains made within the ISA remain tax-free.
Saving into a Pension
Contributions into a pension scheme receive tax relief (provided the relevant conditions are met), making pensions one of the most tax-efficient ways to save for the future. Pension contributions receive tax relief at the individual's highest rate of income tax, and the funds grow free from both income tax and CGT. Upon retirement, typically 25% of the pension pot can usually be withdrawn tax-free, with the remainder subject to income tax when drawn.
How much tax you pay depends on your earnings
The amount of tax you pay depends on your total income for the year, which includes earnings from employment, pensions, benefits, savings, investments and any applicable reliefs or exemptions.
Tax on Interest:
If you earn up to £17,570
To determine your tax-free allowance:
Start with your Personal Allowance, which is £12,570.
£15,640 if you are claiming the Blind Person’s Allowance.
Add up to £6,000 – this covers the maximum amount of the Starting Rate Band for savings and the Personal Savings Allowance (PSA).
Subtract any non-savings income, such as wages or pension.
To put this into practice, see the two examples below based on the standard £12,570 Personal Allowance:
Someone with a £7,000 salary can earn £11,570 in tax-free savings interest (£18,570 minus £7,000).
Someone with a £15,000 salary can earn £3,570 in tax-free savings interest (£18,570 minus £15,000).
If you earn £17,571 to £100,000
For those earning between £17,571 and £100,000, your Personal Savings Allowance (PSA) determines how much savings interest you can earn tax-free.
Tax-Free Allowances based on Earnings:
If you earn £17,570 to £50,270
You can earn up to £1,000 in savings interest tax-free.
Any interest above this amount is taxed at 20% (the basic rate).
If you earn £50,271 to £100,000
You can earn up to £500 in savings interest tax-free.
Any interest above this is taxed at 40% (the higher rate).
If you earn £100,001 to £125,140
For those earning between £100,001 and £125,140, your Personal Allowance goes down by £1 for every £2 that your adjusted net income is above £100,000.
Tax-Free Allowances based on Earnings
If you earn £100,001 and £125,140
You can earn up to £500 in savings interest tax-free.
Any interest above this is taxed at 40% (the higher rate).
If You Earn Over £125,140
Once your annual income exceeds £125,140, you lose the Personal Savings Allowance and Personal Allowance entirely. All interest earned on savings will be taxed at the additional rate of 45%.
Tax on Dividends:
Most of your investment income is taxed at the same rate as your other income and counts towards your Personal Allowance. However, there is a separate tax-free allowance if you own shares or dividend-paying OEIC/unit trust funds.
For the upcoming 2025/26 tax year, you can earn up to £500 in dividends without paying tax. This is the Dividend Allowance, and unlike tax on interest, the dividend allowance is available to anyone no matter their level of income.
How to report investment income and capital gains on tax return
You must complete and submit a Self-Assessment tax return to HMRC if you have received investment income or made capital gains above your tax-free allowances in any given tax year. Note, there are other options for reporting investment income if it does not exceed £10,000 for a tax year and you wouldn't ordinarily complete a tax return—for more information, read the following information around Tax on dividends and Applying tax-free interest on savings.
To complete a Self-Assessment tax return to report investment income or capital gains, you should do so after the tax year ends on 5th April. You then have until midnight on 31st January following the tax year end to file your Self-Assessment tax return online. If you do not usually send a tax return, you need to register by 5th October following the tax year in which you received investment income or made capital gains.
How can we help?
Our tax planning services include certain products, allowances and guidelines to ensure your money is working its hardest and the tax you pay is minimised where possible.
Our advisers stay on top of all changes to tax legislation within the UK and notify clients as to how and why changes may affect their financial situation.
To find out more about how we can help or for a free initial consultation why not get in touch.
Arrange your free initial consultation
The Financial Conduct Authority (FCA) does not regulate tax advice.
This article is for information only and does not constitute individual advice.
A pension is a long-term investment not normally accessible until age 55 (rising to 57 from April 2028). The value of your investments (and income from them) can go down as well as up, so you may get back less then your originally invested.
Your pension income could also be affected by the interest rate at the time you take your benefits. The tax implications of pension withdrawals will be based on your individual circumstances, tax legislation and regulation which are subject to change.
The information contained within this article is based on our understanding of legislation, whether proposed or in force, and market practice at the time of writing. Levels, bases and reliefs from taxation may be subject to change.
You should seek advice to understand your options at retirement.

Chancellor’s Spring Statement: growth halved, but no tax changes
The Chancellor previously confirmed that she only wanted to make major tax and spending announcements once a year, with this being in the Autumn Budget. Therefore, no tax changes were expected and none were delivered.
The headline from the speech was that the Office for Budget Responsibility (OBR) has halved its 2025 growth estimate for the UK from 2% to 1% in 2025, but it has upgraded its longer term forecasts from 2026 onwards.
Alongside this, previously announced cuts to Welfare and Overseas Aid payments, Increases in Defence spending and Planning Reforms were confirmed.
In terms of signposting future changes that could be announced:
- The government confirmed it is looking at options to reform ISAs to “get the balance right between cash and equities to earn better returns for savers” which could indicate limited cash ISA allowances relative to Stocks and Shares ISA allowances.
- The government will also be holding a series of roundtables with key stakeholders over April as it considers the role of tax reliefs for Enterprise Management Incentives Schemes, Enterprise Investment Schemes and Venture Capital Trusts.
|
Don’t invest unless you’re prepared to lose all the money you invest. This is a high-risk investment and you are unlikely to be protected if something goes wrong. |
|---|
After the pension changes over the last few years and, in particular, last year’s confusion as the new pension rules were ‘bedded in’ and legislation adjusted, it was a relief to have no further tinkering with pension rules.
We already know of course, of various areas of impending change, including the removal of the ‘domicile’ tax regime from 6 April this year, the Business Property Relief and Agricultural Property Relief changes from April 2026 and of course the Pensions and IHT changes from April 2027 – which we await further details on.
These areas and others, including the employer National Insurance increases, are covered off in our Autumn Statement 2024 summary.
There were some changes announced to Universal Credit from 2026 onwards and from this summer it will become possible for those newly liable for the High Income Child Benefit Charge to pay the tax through PAYE rather than via self-assessment.
If you’d like to discuss any of the announcements from the Spring Statement or Autumn Budget last October, and are concerned about how they will affect your financial plan, why not get in touch and speak to one of our expert advisers.
Arrange your free initial consultation
This article is intended for general information only, it does not constitute individual advice and should not be used to inform financial decisions.
The Financial Conduct Authority (FCA) does not regulate tax advice.

MAGA uncertainty creates MEGA returns?
In our previous investment market updates, we have written about US exceptionalism i.e. the idea that the US is distinct to other countries and that this uniqueness means we should expect the US economy and stock market to continue to outperform.
This narrative, however, has been challenged in recent weeks.
Arrange your free initial consultation
President Trump's pledge to Make America Great Again (MAGA) unsettles US markets but could make Make Europe Great Again (MEGA)?
Calls that the world’s largest economy will enter a recession have grown and much has been made of the Federal Reserve Bank of Atlanta and their GDP ‘Nowcast’ model. GDP (Gross Domestic Product) is typically reported on a lagged basis every quarter, however the Atlanta Fed (as it is often referred to) look to forecast each quarter’s GDP as and when new data is released – a real time GDP model if you will - and recent readings of the model have suggested the US economy will contract nearly 2.5% on an annualised basis this quarter (see Figure 1.).
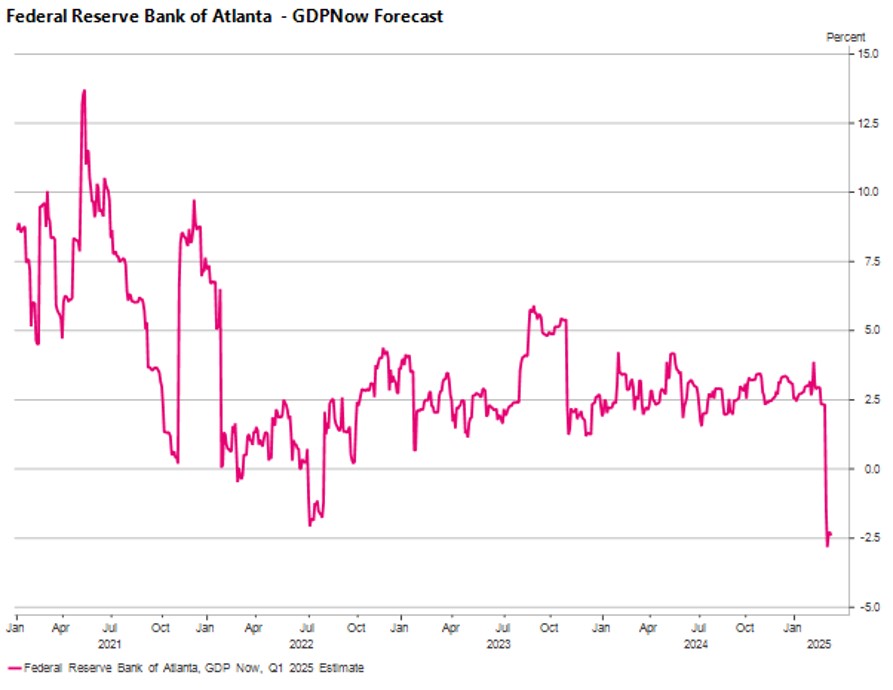 Figure 1: Sharp revision to this quarter’s GDP from the Federal Bank of Atlanta caused panic amongst investors (Source: Macrobond)
Beyond the immediate shock of the headline, on closer inspection we can see that this reading has been heavily distorted and does not reflect the true health of the US economy.
January was one of the coldest months on record in the US – the coldest January since 1988 – and this dampened consumer demand. This had a negative impact but the true distortion came from net exports falling 4% as imports jumped 13% month-on-month as businesses looked to get ahead of the impact of any potential tariffs. This was acutely seen in the import of gold into the US which contributed a large part to this increase in imports.
To put this increase in imports into context you can see the month-on-month change was greater than what we saw in the immediate aftermath of the COVID-19 pandemic and Russia’s invasion of Ukraine in February 2022 (see Figure 2.).
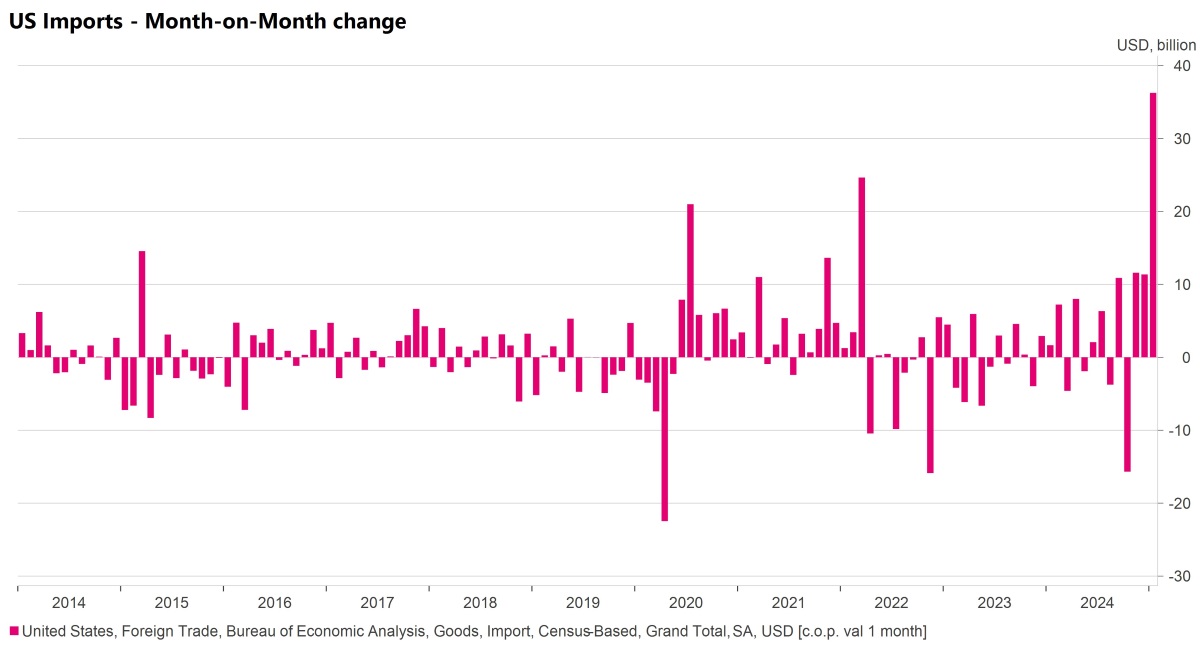 Figure 2: US imports increased markedly in January (Source: Macrobond)
Moving forward we would not expect this to persist and we should see some normalisation in the data, however it’s still unclear whether the US economy will experience a soft or hard landing. It is our belief, at this time, that the eventual outcome will lie somewhere in the middle.
The vagueness of that statement reflects the uncertainty that we see in the US right now as only time will tell what the true impact of the Trump administration’s approach to trade policy will be and how far they will go in cuts to government expenditure.
Rather than the expectation of an impending recession, what we believe we’re seeing is investors repricing risk reflecting the increased level of uncertainty. Investors have also taken the opportunity to look beyond the US and richly valued, growth focused areas of the market to areas which are relatively cheaper and where sentiment is improving.
No region epitomises this more than Europe where an increasingly fractious relationship with the US has heralded a potential ‘sputnik’ moment with the announcement from Germany that it intends to reform its fiscal “debt brake” and spend €500bn rebuilding the country’s infrastructure.
This has helped support the momentum in economic data coming out of Europe as it continues to surprise to the upside (see Figure 3.).
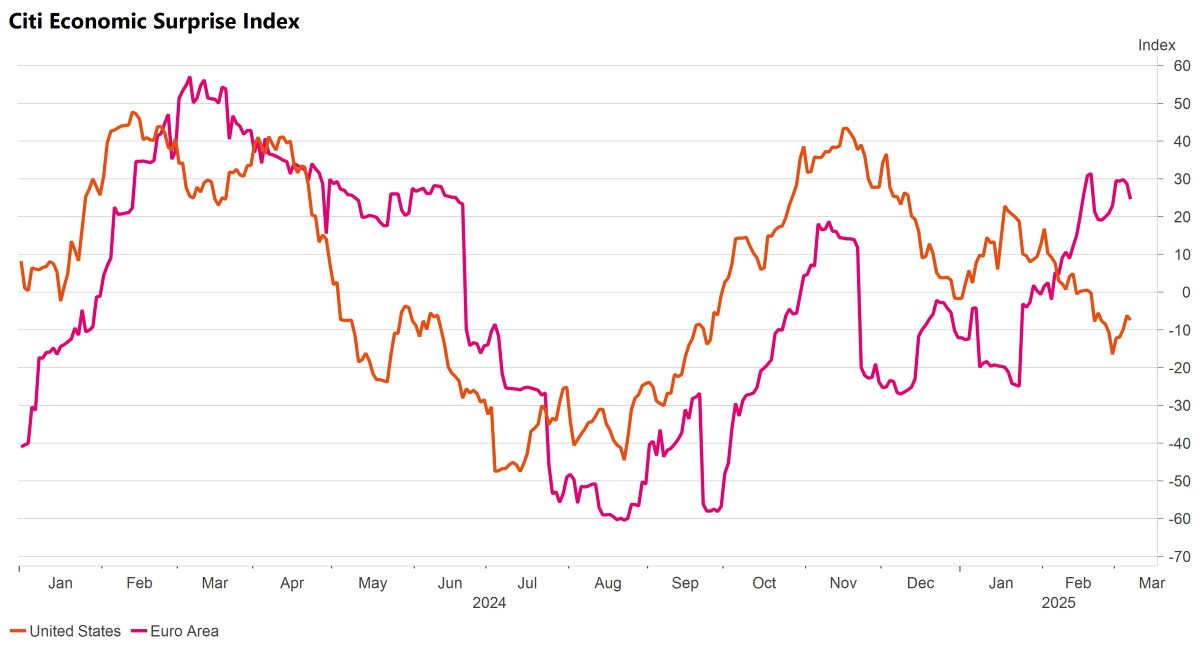 Figure 3: Economic data in Europe has continued to surprise to the upside (Source: Macrobond)
Improving sentiment and the prospect of much needed fiscal spend and investment in the region, combined with cheap valuations, has seen European equities rally year-to-date.
Over January and February, European equities have had their best start to the year relative to US equities since 2015 with the Euro Stoxx 600 outperforming the S&P 500 by nearly 10% (see Figure 4.).
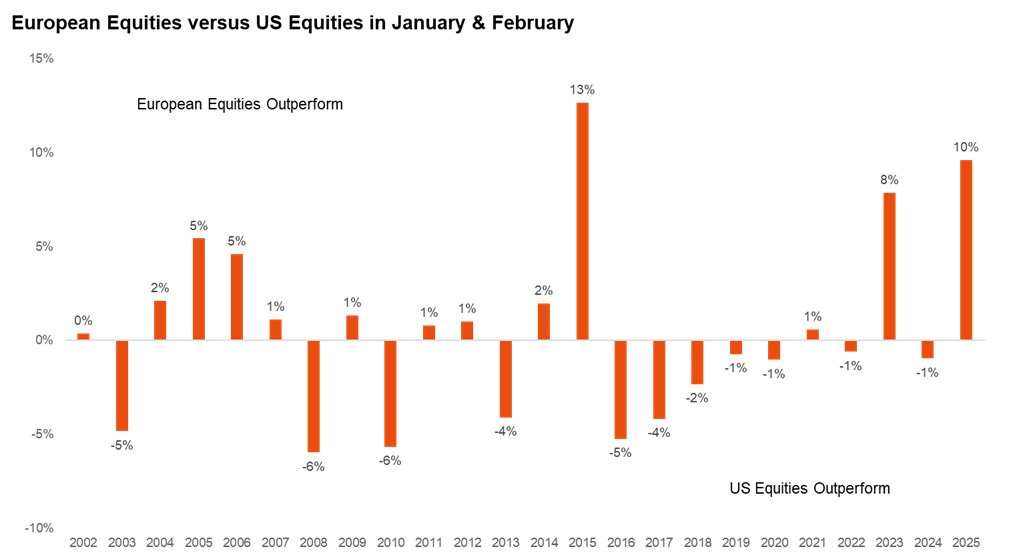 Figure 4: European equities have had their best start to the year relative to US equities since 2015 (Source: Macrobond)
In Government Bonds we saw German 10 year yields move up 30bp in a single day which is the biggest move in the last 35 years. We also saw a move up in broader European Government Bond yields on the prospect of further borrowing (and spending).
Notably we didn’t see the same move in US Government Bonds which is unusual given the historic close correlation, but again this illustrates the diverging paths of the respective economies and fiscal policy (see Figure 5.).
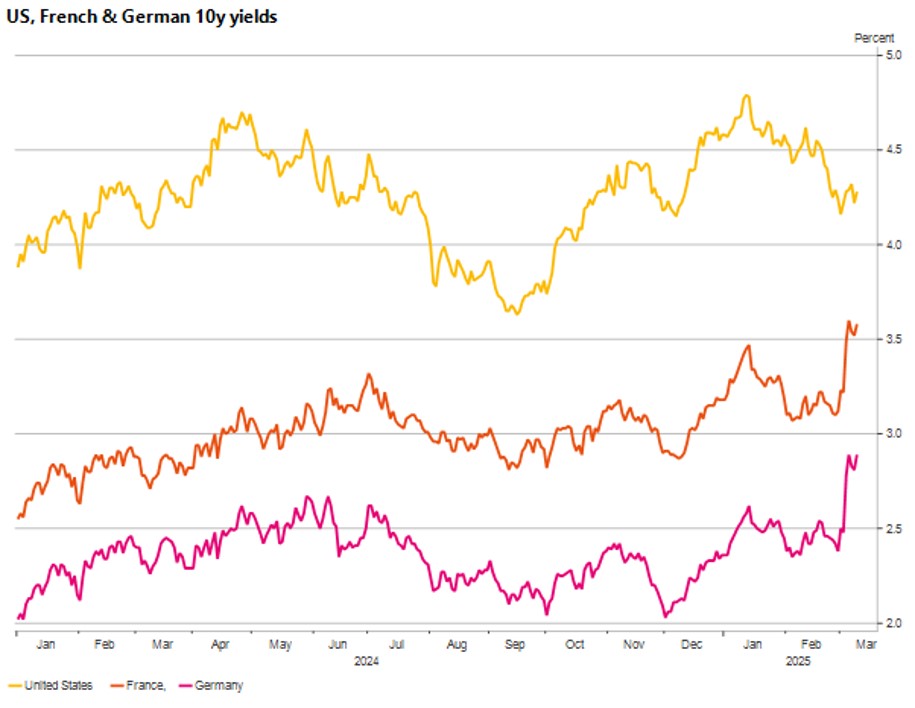 Figure 5: Economic data in Europe has continued to surprise to the upside (Source: Macrobond)
Volatility in markets was not just confined to equities and bonds. Since the start of the year we’ve seen the US Dollar weaken against major currencies. Looking at the DXY Index which measures the strength of the US Dollar against a basket of major foreign currencies, it is down 4% year-to date (see Figure 6.).
This can seem counterintuitive given that tariffs from the US were considered Dollar positive, however the market is now reassessing the impact of tariffs and the negative growth shock this could have on the US.
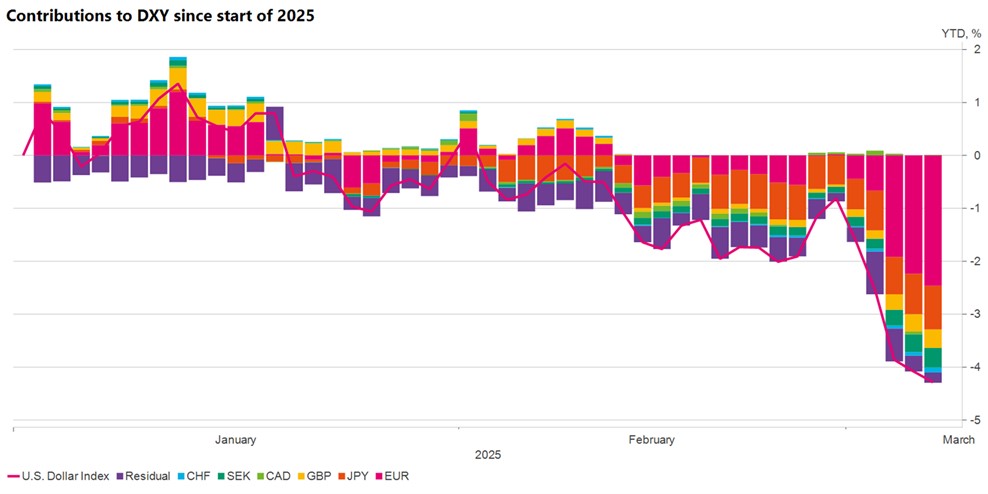 Figure 6: The US Dollar has weakened against major foreign currencies since the start of the year (Source: Macrobond)
Given the current fast moving nature of markets , there’s a possibility that this note will already be out of date by the time that you read it. You’d be forgiven for wondering how today’s or this week’s latest headline will impact your investments.
We understand that uncertainty can be uncomfortable but what we also believe is that uncertainty can become an opportunity assuming one has the right tools. For multi-asset investors, this period of heightened volatility presents the chance to manage risk more effectively and generate returns from different areas, as a broader range of market winners and losers emerge.
As ever, if you have any questions or concerns, please get in contact with your TPO Adviser who can explain how we’re actively managing assets and portfolios to minimise this period of volatility.
Arrange your free initial consultation
The information in this article is correct as at 14/03/2025.
This market update is for general information only, does not constitute individual advice and should not be used to inform financial decisions. Investment returns are not guaranteed, and you may get back less than originally invested; past performance is not a guide to future returns.
Cut to Cash ISA allowance criticised as ‘naïve’
The fight for the future of the cash ISA continues as one of Britain’s biggest building society has waded into a row over whether the government should cut tax breaks on cash ISA's, arguing such a move would reduce the availability of mortgages for first-time buyers.
As covered in our previous article on the cash ISA threat, Rachel Reeves is being lobbied by City firms to scale back or remove tax breaks on the popular cash ISA's. They are putting pressure on Reeves to make these changes so that more focus is put on the riskier practice of investing in the stock market, which they say would boost economic growth and could deliver higher returns to individuals over the long term, although as with any investment that is not guaranteed.
Richard Fearon, CEO of Leeds Building Society, criticised the increasing push from certain City brokers and fund managers to cap cash ISAs in an effort to steer savers toward stocks and shares. He warned that lowering the £20,000 annual cash ISA limit would not only be unpopular among customers but could also lead to higher mortgage rates.
“It’s naïve at best, or deliberate misinformation at worst, for fund managers to say money saved in cash ISA's is dormant,” he said. “We use it to fuel our mortgage lending. If you significantly reduce that funding, mortgage rates would become more expensive for borrowers.”
A survey to Leeds Building Society customers last year found that only 7 per cent were interested in opening stocks and shares ISAs in 2024. It’s clear that many people are not interested in the more risky stocks and shares ISA over the more secure cash ISA, despite what big city firms want.
What is an ISA?
An ISA, or ‘Individual Savings Account’, is a scheme that allows anybody to hold cash, shares and unit trusts free of tax on dividends, interest, and capital gains. Essentially, it’s a savings account that you don’t pay tax on.
A cash ISA is a tax-free savings account that allows people to save cash without incurring income tax on interest. They have become more popular over the past two years due to rising interest rates increasing the competitiveness of savings products.
A stocks and shares ISA is a tax-efficient account that allows you to invest in shares, funds, bonds, and other assets while being sheltered from income and capital gains tax.
You can save up to £20,000 each tax year and receive tax-free interest payments, so when the value of your ISA increases, you get to keep all of it tax-free*.
While there is a £20,000 allowance in place for how much you can put in a year, there is not a cap on how much you can accumulate in an ISA over a lifetime.
When choosing a style of investment to suit your needs, you may want to consider how long you plan to invest for and how much you would like your money to grow. It is also important to understand what movement in value you may or may not be happy with and any potential losses that may happen. That is why getting professional advice can be important for understanding your objectives and options.
If you want to find out more, why not give us a call on 0333 323 9065 or book a free non-committal initial consultation with one of our chartered advisers to see how we can help.
Arrange a free initial consultation
This article is intended for general information only, it does not constitute individual advice and should not be used to inform financial decisions.
Investment returns are not guaranteed, and you may get back less than you originally invested. Past performance is not a guide to future returns.

UK inflation jumps to a 10-month high
UK inflation unexpectedly jumped to 3% in the 12 months to January 2025, marking a ten-month high and catching many analysts off guard. The rising cost of living is up from 2.5% in December and above analyst’s forecasts of 2.8%.
The increase has raised fresh concerns about how long the Bank of England (BoE) will need to keep interest rates higher, meaning potentially the pain will be prolonged for borrowers – but could signal better news for savers
The rise in inflation has been driven by several key factors. Airfares, which typically drop sharply after the holiday season, didn't fall as much as expected, keeping travel costs higher. On top of that, the introduction of VAT on private school fees has pushed up tuition costs, adding to the pressure. Food and non-alcoholic drink prices have also edged up, squeezing household budgets even further. Meanwhile, core inflation, which strips out volatile items like food and energy, has also climbed to 3.7%, and services inflation is now running at 5%. All of this suggests that inflation is proving more stubborn than the BoE might have hoped.
This latest inflation surprise makes the BoE’s monetary policy strategy more complicated. The Bank had been moving toward cutting interest rates this year, particularly given the weak economic growth seen in recent months. But with inflation coming in higher than expected, policymakers may have to hold off on rate cuts for longer to ensure inflation doesn’t start climbing again. Some experts still believe rate cuts are on the way, but this inflation spike could slow things down and force the Bank to take a more cautious approach.
Whilst bad news for borrowers, for cash savers this uncertainty around interest rates has some important implications. If the BoE keeps rates higher for longer, that could be good news for those with savings as banks and building societies may also be slower to cut rates – particularly on fixed term accounts. However, inflation at 3% means that unless you’re earning at least that much interest on your savings, the real value of your money is being eroded over time.
For example, if you have £10,000 in the Lloyds Easy Saver account which is paying just 1.10% AER on balances of between £1 and £25k, after a year the real value of your money would have fallen to £9,816, assuming inflation were to remain at 3%. If you were to move that £10,000 to an account earning 4%, your cash would have actually increased in value, even after the effect of inflation, to £10,097 in real terms.
Check if your savings are keeping ahead of inflation with our inflation calculator below:
Now more than ever, it’s important to make sure your money is working as hard as possible. Shopping around for the best interest rates is key, as banks are still offering a mix of competitive and disappointing deals. Fixed-rate savings accounts might be worth considering if you want to lock in a good rate before any potential cuts in the future. Meanwhile, cash ISAs remain a great way to shield your savings from tax, helping you to maximise your returns.
With inflation still proving unpredictable and interest rates in a state of flux, keeping an eye on the financial landscape and the interest rates you are earning on your savings is essential. By staying informed and being proactive with your savings, you can make the most of the current situation and ensure your money is working for you.
Arrange a free initial consultation
This article is intended for general information only, it does not constitute individual advice and should not be used to inform financial decisions.
The Financial Conduct Authority (FCA) does not regulate cash advice.
The accounts and rates mentioned in this article are accurate and correct as of 20/02/2025.