Skip to main content
A Christmas Slaying for the Magnificent Seven
Reflecting on a resilient market year
As we approach the end of the year I find myself experiencing déjà vu.
It has been another remarkable period for risk assets. Fears of a ‘hard landing’ or recession did not materialise and investors were able to ignore the noise of the largest ever global election cycle as c. 50% of the world’s population took to the polls this year.
Arrange your free initial consultation
Stable growth and declining inflation
Global growth remained stable and this coincided with headline inflation continuing to fall across the US, UK and Europe and with that, Central Banks in the respective economies have now begun to cut interest rates (see Figure 1.).
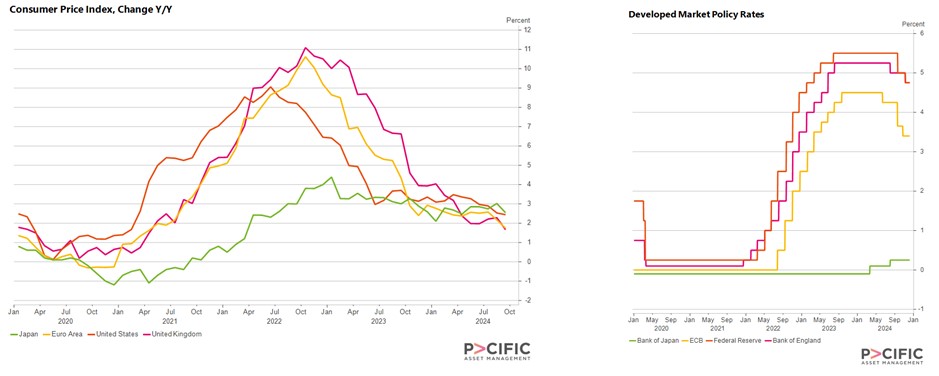 Figure 1: Consumer Price and Interest Rates (Source: Macrobond)
Diverging growth prospects for 2025
Moving forward I expect the global economy and financial markets to be something of a mixed picture.
The OECD expects Real Global GDP to be 3.3% next year, however we see growth prospects differing significantly between countries. The US economy is forecasted to grow 2.8% next year whereas Germany (the world’s third largest economy) - which faces a combination of political risk home and abroad and an anaemic manufacturing sector - is expected to grow just 0.7% next year1 .
Inflation trends and labour market shifts
Another consideration is the path of inflation as this will be a key determinant as to how many interest rate cuts we see next year.
Headline inflation, as mentioned above, has fallen meaningfully, however there are other measures of inflation that Central Banks monitor. One of these is Services inflation which is the measure of prices in the service and hospitality sector. Post- pandemic we saw a distortion in labour markets where there were too few people for the number of jobs available, which saw wage growth in the western world increase as individuals leveraged their position in a limited pool of labour.
However, as the number of job openings has decreased from those post-pandemic highs and the unemployment rate has started to rise, we have started to observe a slowing of pay growth, which has also coincided with some weakening of labour markets.
Additionally, the number of "job quits" in the US has decreased, which offers additional insight into the labour market because, generally speaking, people only want to change professions when there are better roles/openings and when they can earn more money elsewhere (see Figure 2).
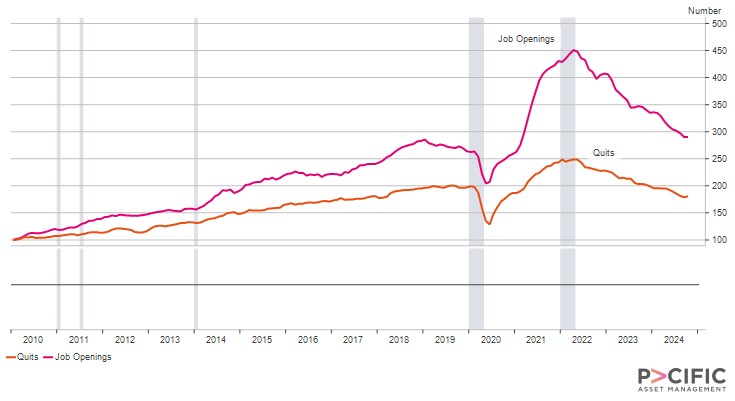 Figure 2. US Job Openings and Quits (Source: Macrobond)
Positive outlook for corporate earnings
Corporate earnings are expected to improve next year with US corporates (once again) forecasted to produce the highest level of earnings growth.
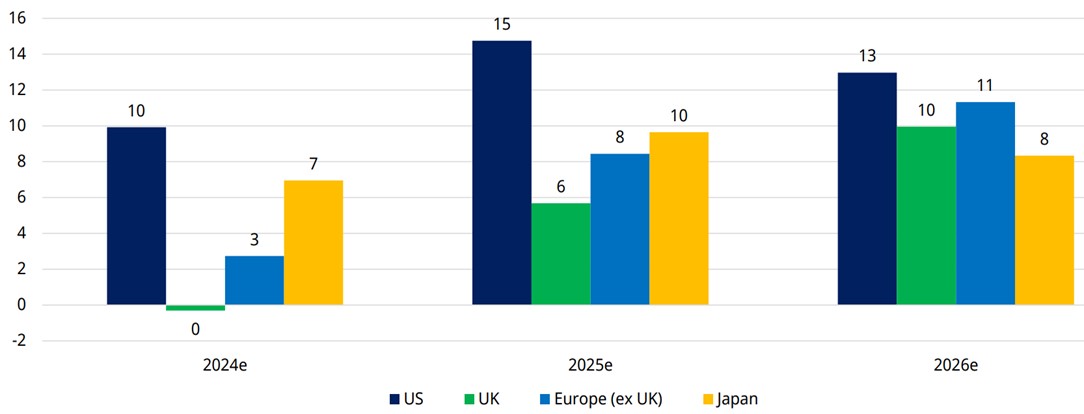 Figure 3: Corporate Earnings: Consensus YoY EPS growth forecasts % (Source: Schroder Equity Lens – December 2024)
The question as to whether this level of earnings growth will materialise will be key for investors.
US equity market performance and valuations
To the end of November, the S&P 500 – an index of the 500 biggest companies in the US – was up c.28% since the start of the year and this followed the less - but still impressive - return of c.19% in 2023. This means (when considering the benefit of compounding) the index is up 53% since January 2023 which is in stark contrast to other regional equity markets where UK, European and Japanese equities returned 17-23% over the same time period (see Figure 4.)
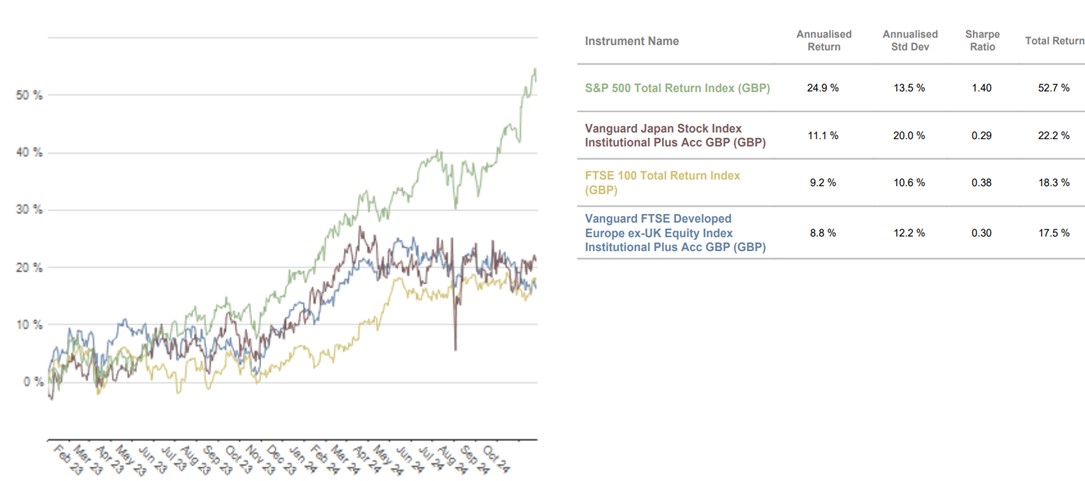 Figure 4. Regional equity returns (Source: Pacific Asset Management)
Given this relative outperformance of US equities, if you were to look at the MSCI World index which is made up of the largest c. 1,500 public companies in developed markets based on size (the technical term being market ‘capitalisation’) you would see that US equities make up over 70% of the index. This is why investors should be cognisant that when investing into ‘global equities’ they are in turn (and perhaps inadvertently) investing a significant amount into the US stock market.
What this means from a valuation perspective is that US equities are considered expensive, not just compared to other regional equity markets like the UK, but also relative to its own history.
One could have made this comment several times over the last decade and if you were a valuation purist then you would have missed out on a significant return. That said, when you consider the valuation of the ‘Magnificent 7’ - which collectively represent approximately 30% of the S&P 500 - and compare it with the broader index otherwise known as the S&P 493, then it does raise the question of how much of that future earnings growth is already priced in and whether these companies can continue to produce sales growth in excess of 20% per annum2.
The divergence in valuation between the Magnificent 7 and the broader S&P 500 can be seen below where we are comparing their respective forward price-to-earnings ratios i.e a measure of how much an investor must pay for a company’s forecasted earnings in 12 months’ time.
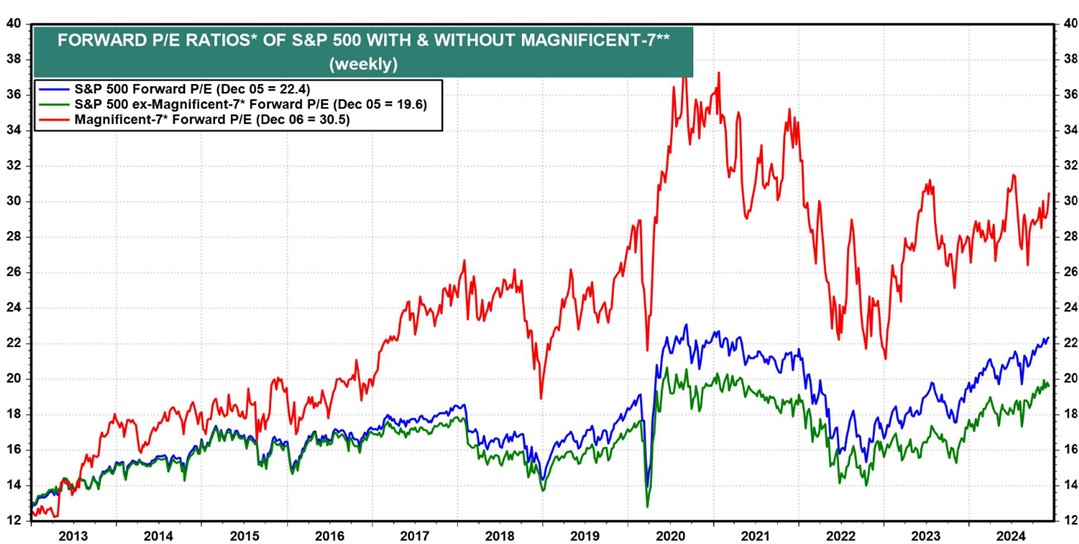 Figure 5. US equity price-to-earnings ratio (Source: Yardeni – December 2024)
Looking ahead we are certainly not calling an end to the exceptionalism of the US economy and equity market, but we do see a broadening out of this feature.
In 2023 the ‘Magnificent 7’ outperformed on an earnings growth basis and they benefited accordingly, however it is expected that we will see an improvement in earnings for companies in the ‘S&P 493’ which when you consider the relatively cheap valuation compared to their ‘magnificent’ peers could represent an opportunity for investors.
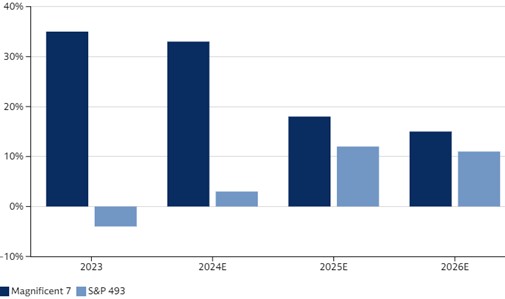 Figure 6. US earnings expectations (Source: Goldman Sachs research – December 2024)
Looking ahead to 2025
We will return to the outlook for 2025 in January. However, reflecting on 2024 suggests that next year will be a year where investors should reacquaint themselves with the fundamentals of investing, for instance, companies that are improving their earnings whilst trading at a cheap valuation should do well over the long-term. Having a diversified portfolio will continue to reduce risk but will also provide the opportunity for returns in markets which some investors have (up until recently) neglected.
As ever, if you have any questions about navigating your personal investment environment, please don’t hesitate to contact your adviser or one of the TPO team.
Arrange your free initial consultation
Notes:
1 Figures referenced are from the OECD’s latest economic outlook which was released on 4 December 2024
2 The Magnificent 7 refers to Apple, Microsoft, Amazon, Alphabet (Google), Tesla, Nvidia and Meta Platforms.
The information in this article is correct as at 13/12/2024.
This market update is for general information only, does not constitute individual advice and should not be used to inform financial decisions. Investment returns are not guaranteed, and you may get back less than originally invested; past performance is not a guide to future returns.

Trump's return - investment boom or inflationary timebomb?
The US election has dominated headlines and markets over the recent past, with each upwards swing in Trump’s odds driving the dollar and US government bond yields higher. Now that the US election has delivered a new President, we can consider how markets have reacted and the broader economic implications.
Arrange your free initial consultation
Trump's Consolidation of Power
It is now clear that Donald Trump and the Republicans have won a resounding victory, sweeping the Presidency, the Senate, and the House of Representatives. Additionally, the Republicans retain a majority in the Supreme Court and are expected to ‘pack the benches’ of the lower courts at the beginning of the Trump presidency. This result gives Trump almost complete control over the three arms of US government, making it likely that he will be able to push forward with his agenda relatively unimpeded.
What does the 47th President intend to do with this power? Separating rhetoric from policy can be difficult with Trump, as exaggerated rhetoric is often used as a negotiating tactic and is part of Trump’s ‘Art of the Deal’. A sense of what really matters to Trump can be gleaned from his most frequent public utterances on certain policy issues.
Key Economic Priorities Under Trump
The three most consistent issues with economic implications have been:
- Reductions in immigration and closing of the loopholes in the asylum system
- The China trade threat
- The use of tariff policy to rebalance American trade
US Equity Market Response
In recent years he has also flipped his script on the need for a balanced government budget, from a fiscal hawk in the 80s and 90s to ‘the great protector’ of social security programs in the 2024 election. Continued lavish government spending in combination with his proposed tax cuts creates inflationary pressure.
At a headline level the pursuit of these aims has two primary economic impacts, the first being upwards pressure on medium-to-long term inflation, the second being an increased incentive to bring goods manufacturing back to the US.
The inflationary aspect causes rising government bond yields (investors must be compensated for the risk of rising inflation over the period they hold a bond), which, in combination with the direct appreciation impact of tariffs and the smaller trade deficits they produce, have resulted in upwards pressure in the value of the dollar. The manufacturing onshoring aspect has been a boon to the stock prices of medium and smaller sized US companies that are more exposed to domestic US supply chains and will therefore see the most benefit from a rejuvenation in those supply chains.
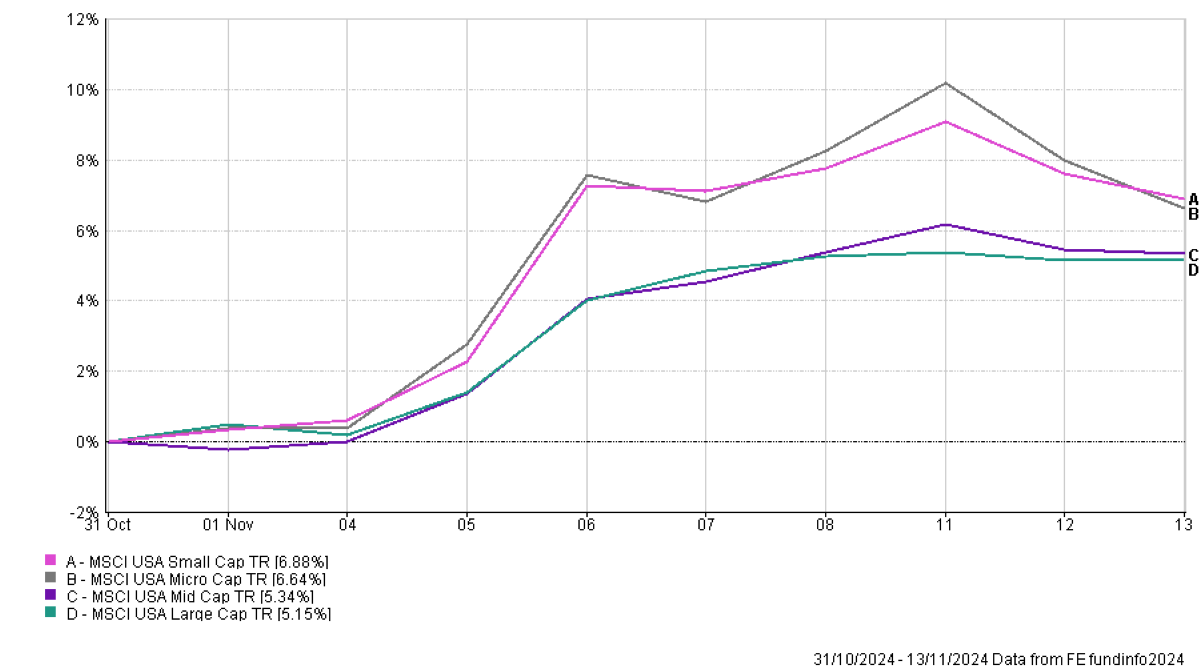 Figure 1 – US equity market returns split by market capitalization – Source: FE Analytics, 2024.
Once Trump’s election victory became clear to markets on the 6th of November there was a rapid surge in US equity prices. Smaller companies, which have lagged their larger counterparts over recent years, surged ahead of the wider market.
Small companies, at least conceptually, are set to benefit in multiple ways:
- Trump has consistently pushed for the Federal Reserve to lower interest rates and small companies are more dependent on borrowing, so more responsive to lower rates;
- Onshoring of manufacturing should benefit the companies most exposed to domestic US supply chains, as smaller companies are;
- Deregulation is likely to benefit smaller companies, as the costs of regulation are more easily borne by the largest companies and so create barriers to market entry for small firms.
Global Equity Market Trends
Casting our net a little wider into the global equity ponds we can get a feeling for how investors expect the Trump regime to impact the key trading partners of the US.
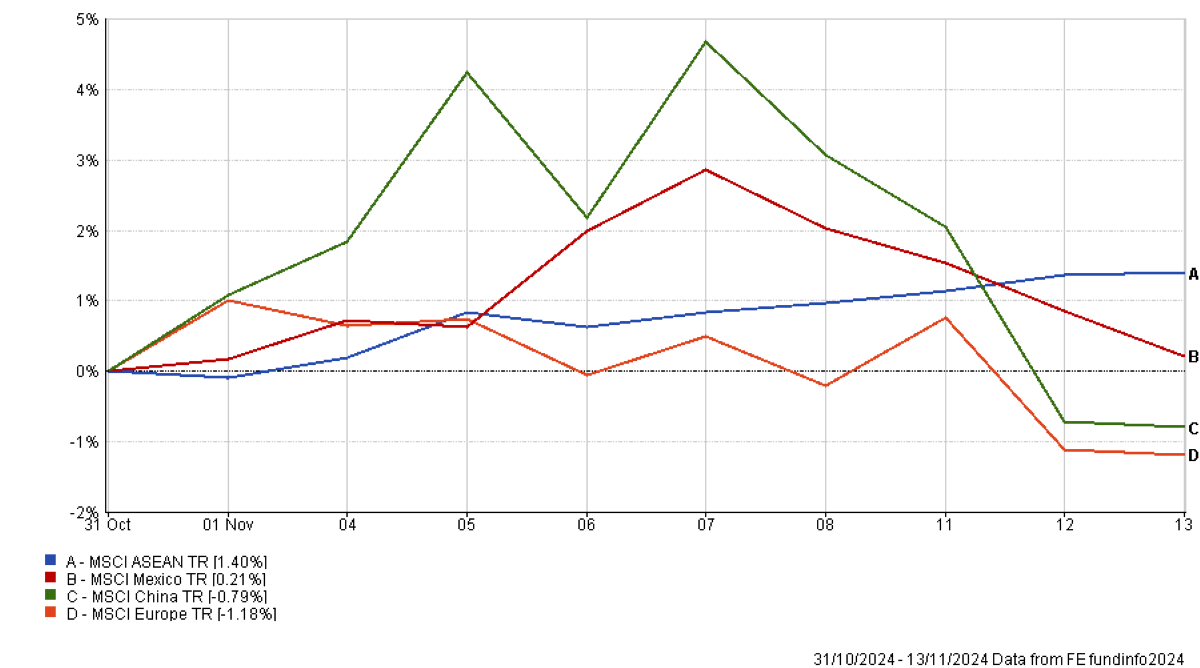 Figure 2 – Regional equity market returns for key US trade partners – Source: FE Analytics, 2024.
Starting with the clearest loser of the situation, Europe. With an increasingly domineering US to the west, growing China to the east and a deindustrialising Germany at the centre the EU is facing pressures last seen during the 2012 Euro crisis, although arguably more existential. Sentiment towards the European economy and equity market was weak to start with and Trump’s election has only reinforced this.
The reaction in Chinese equity markets has been more mixed, but ended in pessimism. On election day equities fell as the prospect of a full blown trade war rose, the day after election equities rose on the narrative of a ‘grand bargain’ between the US and China – a deal that only Trump “the dealmaker” could make unimpeded by the Democrat’s ideological red-lines over human rights and the Chinese system of government. This optimism soon petered out and Chinese equities fell from the 8th onwards.
Where the reaction has been far more positive is in countries that have been the biggest beneficiaries of the shift in trade patterns away from direct ‘China to US’ trade to indirect ‘China to intermediary country to US’ trade. The Association of South East Asian Nations (ASEAN) and Mexico have benefitted a great deal from this so far and markets expect this trend to continue.
Fixed Income Market Response
Finally, we’ll take a look at the response of the fixed income markets. Since September, when Trump’s victory probability began to rise, so did government bond yields as markets began to price in the potential inflationary impact of Trump’s policy mix, meaning that by election day much had already been priced in. Even so, there was a spike in the 10-year US government bond yield, a fall in yields from the 7th-11th and then a rise back to the election day levels – investors remain concerned with Trump’s inflationary impact.
Conclusion
So, where does that leave us in terms of portfolio allocations? While at first sight Trump’s tariff policy seems set to benefit US firms at the expense of non-US firms, the positive equity market response in Mexico and ASEAN show that it still pays to hold a portfolio that is diversified across multiple regions – in the event that one region is negatively impacted this can be balanced by positive impacts to other regions. Additionally, it has paid, and is likely to continue to pay, to diversify US equity allocations out from the largest companies in the S&P 500 – to that end our Managed portfolios maintain a direct allocation to mid and smaller sized US companies.
As the investment landscape becomes increasingly complex the benefits of a portfolio constructed by investment professionals and run by experienced managers increase – please contact your adviser to discuss how a risk appropriate portfolio can be constructed for you.
Arrange your free initial consultation
The information in this article is correct as at 15/11/2024.
This market update is for general information only, does not constitute individual advice and should not be used to inform financial decisions. Investment returns are not guaranteed, and you may get back less than originally invested; past performance is not a guide to future returns.
Autumn Budget 2024
In one of the longest ‘Budget’ speeches in memory, Chancellor Rachel Reeves gave the first Labour Budget speech for nearly 15 years on 30 October 2024.
Here we’ve summarised the main elements of interest for financial planning, with further details on tax rates and allowances for 2025/26 (to compare to 2024/25) available on the government website.
If you have any concerns or questions about any of the announcements and would like to speak to one of our expert financial advisers, contact us for a free initial consultation to see how we can help.
Arrange a free initial consultation
Non- domicile changes
The non-domicile tax regime is to be abolished from 6 April 2025. Domicile will no longer be a feature of the UK tax system and will be replaced by a system based on residency.
The government will:
- Introduce a new 4-year foreign income and gains regime for new arrivals who have not been UK tax resident in the previous 10 years
- Allow individuals previously taxed on the remittance basis to remit pre-6 April 2025 foreign income and gains using a new Temporary Repatriation Facility
- Reform Overseas Workday Relief
- Replace the domicile-based system for inheritance tax with a residence-based system
VAT on private school fees
From January 2025, 20% VAT will apply to private school fees across the UK and the business rates charitable rates relief for private schools in England will be removed.
Income tax and personal National Insurance (NI)
Income tax bands and personal NI thresholds remain frozen until April 2028. This time period hasn’t been extended and from 2028/29 these bands/thresholds will increase with inflation.
Capital gains tax (CGT) changes
Investors’ Relief
Investors’ Relief (IR) provides for a lower rate of CGT to be paid on the disposal of ordinary shares in an unlisted trading company where certain criteria are met, subject to a lifetime limit of £10 million of qualifying gains for an individual.
This measure reduces the lifetime limit from £10 million to £1 million for IR qualifying disposals made on or after 30 October 2024.
CGT rates
The main rates of Capital Gains Tax (that apply to assets other than residential property and carried interest), will increase from 10%/20% to 18%/24% respectively for disposals made on or after 30 October 2024.
The main rate of Capital Gains Tax that applies to trustees and personal representatives will increase from 20% to 24% for disposals made on or after 30 October 2024.
The rate of Capital Gains Tax that applies to Business Asset Disposal Relief and Investors’ Relief is increasing to 14% for disposals made on or after 6 April 2025 and from 14% to 18% for disposals made on or after 6 April 2026.
Carried interest
Carried interest, which is a form of performance-related reward received by fund managers, primarily within the private equity industry, will be subject to a CGT rate of 32% from April 2025 (current rates are 18% and 28%). From April 2026, carried interest will be subject to a revised regime within the income tax framework.
Inheritance tax (IHT) changes
Freezing of IHT thresholds
The Inheritance Tax thresholds were already fixed at their current levels until April 2028. This time period has been extended to April 2030. This measure will fix the:
- Nil-rate band at £325,000
- Residence nil-rate band at £175,000
- Residence nil-rate band taper, starting at £2 million
Inherited pensions
From 6 April 2027, when a pension scheme member dies with unused funds or without having accessed all of their pension entitlements, those unused funds and death benefits will be treated as being part of that person’s estate and may be liable to Inheritance Tax. The current distinction in treatment between discretionary and non-discretionary schemes will be removed.
The change will apply to both DC and DB schemes. It will apply equally to UK registered schemes and QNUPS. This will ensure that most pension benefits are treated consistently for Inheritance Tax purposes, regardless of whether the scheme is discretionary or non-discretionary, DC or DB.
A small number of specified pension benefits will remain outside scope for Inheritance Tax, including where funds can only be used to provide a dependants’ scheme pension. These are currently out of scope in non-discretionary schemes and so will remain out of scope under this change.
Pension scheme administrators will become liable for reporting and paying any Inheritance Tax due on pensions to HMRC. This will require pension scheme administrators and personal representatives to share information with one another.
A technical consultation has been issued on the processes required to implement these changes for UK-registered pension schemes. After the consultation, the government will publish a response document and carry out a technical consultation on draft legislation for these changes in 2025.
The government will continue to incentivise pension savings for their intended purpose of funding retirement, supported by ongoing tax reliefs on both contributions into pensions and on the growth of funds held within a pension scheme.
Agricultural relief and business relief
From 6 April 2025, the existing scope of agricultural relief will be extended to include land managed under an environmental agreement with, or on behalf of, the UK government, devolved governments, public bodies, local authorities, or relevant approved responsible bodies.
From 6 April 2026, agricultural relief (AR) and business relief (BR) will be reformed, as summarised below:
- The 100% rate of relief will continue for the first £1 million of combined agricultural and business property to help protect family farms and businesses, and it will be 50% thereafter.
- The rate of business relief will reduce from 100% to 50% in all circumstances for shares designated as “not listed” on the markets of recognised stock exchanges, such as AIM.
The reforms are expected to only affect around 2,000 estates each year from 2026/27, with around 500 of these claiming agricultural relief and around 1,000 of these holding shares designated as “not listed” on the markets of recognised stock exchanges.
The government will publish a technical consultation in early 2025. This will focus on the detailed application of the allowance to lifetime transfers into trusts and charges on trust property. This will inform the legislation to be included in a future Finance Bill.
More detail is available at gov.uk.
National insurance
Employer NI is to increase to 15% (from 13.8%) from April 2025 and the secondary threshold will reduce to £5,000 (from the current £9,100), i.e. employer NI will become payable on an employee’s earnings above £5,000pa.
The Employment Allowance, a National Insurance exemption for smaller businesses, will increase to £10,500 (from £5,000).
Pensions
Qualifying recognised overseas pension scheme (QROPS)
The Overseas Transfer Charge (OTC) is a 25% tax charge on transfers to QROPS, unless an exclusion from the charge applies.
The government has announced that they are removing the exclusion from the OTC for transfers made on or after 30 October 2024 to QROPS established in the EEA and Gibraltar.
Also, from 6 April 2025, the conditions of OPS and ROPS established in the EEA will be brought in line with OPS and ROPS established in the rest of the world, so that:
- OPS established in the EEA will be required to be regulated by a regulator of pension schemes in that country
- ROPS established in the EEA must be established in a country or territory with which the UK has a double taxation agreement providing for the exchange of information, or a Tax Information Exchange Agreement
From 6 April 2026, scheme administrators of registered pension schemes must be UK resident.
Aligning the treatment of transfers to QROPS established in the EEA and Gibraltar with that of transfers to QROPS established in the rest of the world will help to ensure that some UK residents do not benefit from a double tax-free allowance whilst remaining in the UK and reduces the risk of around £1 billion of UK tax-relieved pension savings being transferred overseas across the scorecard.
Changing the conditions EEA schemes need to meet in order to become an OPS or ROPS will mean that they will have to meet the same conditions as those which are established anywhere else in the world.
Requiring scheme administrators of registered pension schemes to be UK resident will mean that all administrators of registered schemes will need to meet the same conditions.
Further details are available at gov.uk.
Employee Ownership Trusts and Employee Benefit Trusts
Targeted reforms are to be made to the Employee Ownership Trust tax reliefs to ensure that the reliefs remain focused on the intended purpose of encouraging and supporting employee ownership, whilst preventing opportunities for the reliefs to be abused to obtain tax advantages outside of these intended purposes.
Details are available at gov.uk
Stamp Duty Land Tax (SDLT)
The higher rates of Stamp Duty Land Tax (SDLT) for purchases of additional dwellings (second properties) and for purchases by companies is increasing from 3% to 5% above the standard residential rates of SDLT.
This measure also increases the single rate of SDLT payable by companies and other non-natural persons purchasing dwellings over £500,000, from 15% to 17%.
Both changes apply to transactions with an effective date on or after 31 October 2024.
National Minimum Wage
The National Living Wage will increase from £11.44 to £12.21 an hour from April 2025. The National Minimum Wage for 18 to 20-year-olds will also rise from £8.60 to £10.00 an hour.
State benefit and state pension increases
From April 2025, a 4.1% increase to the basic and new State Pension meaning the full new State Pension will rise from £221.20 to £230.25 a week, while the full basic State Pension will increase from £169.50 to £176.45 per week.
The Pension Credit Standard Minimum Guarantee will increase by 4.1% from April 2025, meaning an annual increase of £465 in 2025/26 in the single pensioner guarantee and £710 in the couple guarantee.
Working-age state benefits and the Additional State Pension will rise by 1.7% in April 2025, in line with inflation.
Furnished holiday lettings (FHL)
As previously announced, the furnished holiday lettings (FHL) tax regime will be abolished from April 2025, removing the tax advantages that landlords who offer short-term holiday lets have over those who provide standard residential properties.
The current rules provide beneficial tax treatment for furnished holiday lettings compared to other property businesses in broadly four key areas:
- Exemption from finance cost restriction rules (which restrict loan interest to the basic rate of Income Tax for other landlords)
- More beneficial capital allowances rules
- Access to reliefs from taxes on chargeable gains for trading business assets
- Inclusion as relevant UK earnings when calculating maximum pension relief
The abolition of the FHL regime will mean that income and gains will then:
- Form part of the person’s UK or overseas property business
- Be treated in line with all other property income and gains
If you’d like to discuss any of the changes announced in the Autumn Budget or would simply like to explore ways that you can minimise the amount of tax you pay on your wealth, why not get in touch and speak to one of our expert team of advisers. We’re offering anyone with £100,000 in savings, investments or pensions a free financial review worth £500.
Arrange a free initial consultation
This article is intended for general information only, it does not constitute individual advice and should not be used to inform financial decisions.
The Financial Conduct Authority (FCA) does not regulate cash flow planning, estate planning or tax.
The information contained within this article is based on our understanding of legislation, whether proposed or in force, and market practice at the time of writing. Levels, bases and reliefs from taxation may be subject to change.

Labour’s first Budget in 14 years - What's the impact?
Nearly 4 months after the general election, Chancellor Rachel Reeves finally delivered her eagerly anticipated Budget this afternoon.
It had been widely reported that there would be tax rises and speculation had been rife that pensions, capital gains tax and inheritance tax could be targeted to raise tax revenue following Labour’s manifesto commitment not to increase taxes on “working people”.
In the end, changes to all three of these areas were announced as Reeves looks to raise taxes by £40bn, though the changes were not to the extent that many had feared.
Arrange your free initial consultation
Capital Gains Tax
The main rate of Capital Gains Tax will increase for basic rate tax payers from 10% to 18% and for higher rate tax payers from 20% to 24%. This change will take effect immediately. Capital Gains Tax on second properties will remain unchanged.
There had been rumours that capital gains tax rates would be equalised with income tax rates, so the changes could be viewed as relatively modest compared to potential increases of this level.
Pensions
Investors will have been pleased to see that no changes were announced to the maximum tax free cash that can be taken from pensions or the tax relief available on pension contributions. However, it was announced that unused pension funds and death benefits payable from a pension will be included in the value of estates for inheritance tax purposes from 6 April 2027. This will affect individuals who were previously planning to leave their pensions to beneficiaries rather than to spend them in their lifetimes, though income taken from pensions in excess of tax free cash entitlements is subject to income tax and will then form part of the estate for inheritance tax purposes if not spent, so careful planning will be needed to ensure funds are not taxed twice.
Inheritance Tax
Aside from inherited pensions entering the estate for inheritance tax purposes in 2027, there were a couple of additional changes to inheritance tax rules.
Firstly, the freezing of the nil rate band (£325,000) and Residence Nil Rate Band (£175,000) until 2030 was announced. For reference, the Residence Nil Rate Band is generally available when a main residence is passed to direct descendants and this, combined with the nil rate band, generally gives married couples £1m which can be passed to direct descendants inheritance tax free on the second death of them both.
Additionally, there had been rumours that the inheritance tax break on shares listed on the Alternative Investment Market (AIM), if held for two years before death, would be scrapped. However, the Chancellor instead took a ‘half way’ approach by introducing a 20% inheritance tax rate in respect of these shares.
The Chancellor also announced changes to two lesser-known inheritance tax reliefs, Business Relief and Agricultural Relief, which will now be subject to a 20% inheritance tax charge on qualifying asset values over £1 million.
Income Tax, Employee’s National Insurance and VAT
As expected there were no increases in these three areas given they affect “working people”. However, with income tax bandings already frozen until 2028, there was an expectation the Chancellor may extend this date, but this did not prove to be the case, as the Chancellor confirmed the freezing of these bandings would end in 2028.
Given the above changes were not to the level expected, how has the Chancellor raised £40bn?
Employer’s National Insurance
A large proportion of this £40bn (an estimated £25bn) will be funded by a large increase in employer’s National Insurance contributions from 13.8% to 15% and a reduction in the threshold from which these are paid from £9,100 to £5,000.
Stamp Duty on second properties
Landlords will be disappointed to see the stamp duty surcharge on second properties increasing from 3% to 5% with effect from 31 October.
Non-Dom tax status abolished
As expected, the Chancellor confirmed Labour’s plans to abolish “non-dom” tax status.
Overall, after weeks of speculation, the tax rises announced in the budget were not to the extent that many had feared. Individuals with pensions will be relieved to see no reduction in their maximum tax free cash entitlement and no change to the tax relief they can receive on pension contributions. Investors may also feel increases in capital gains tax rates could have been worse. Instead, businesses were left to fund the majority of the tax rises through their National Insurance contributions.
However, these changes to inheritance tax, pensions and capital gains tax rules will mean financial plans will need to be revisited. To discuss the implications of the budget for your personal financial situation, please contact your TPO Independent Financial Adviser.
Arrange your free initial consultation
The Financial Conduct Authority (FCA) does not regulate estate planning or tax advice.
This article is intended as information only and does not constitute financial advice.
The opinions shared in this article are solely those of the individual and they do not necessarily reflect those of The Private Office.
The information contained in this article is based on our understanding of legislation, whether proposed or in force, and market practice at the time of writing. Levels, bases and reliefs from taxation may be subject to change.

Federal Reserve and Chinese central bank – unusual bed fellows or fiscal allies?
In our last Investment Market Update we covered the recovery in markets following early August’s volatility and the beginning of a slowdown in US technology equities.
Since then, policymakers from both sides of the Pacific have provided stimulus measures to markets, with the US starting their interest rate cutting cycle with a bang, delivering two rate cuts in one meeting, followed by the announcement by Chinese authorities of new fiscal and monetary stimulus measures.
In this month’s update we will take a closer look at Chinese stimulus, it’s expected economic effectiveness and ongoing market impacts, along with the impact of these initial US rate cuts on markets.
Arrange your free initial consultation
US Rate Cuts
The US Federal Reserve (Fed) chose to cut rates by 0.5% at their September 18th meeting. Interest rate rates are typically changed by 0.25% at a time, so this ‘double cut’ was a surprise to some investors. Fed Chairman Jerome Powell cited falling inflation, as well as emphasising initial signs of weakness in job markets that he would like to get ahead of with pre-emptive interest rate cuts.
Markets at this point were expecting a further weakening in jobs figures and anticipated two more ‘double cuts’ at the November and December Fed meetings. In equity markets investors crowded back into the ‘Magnificent 7’ technology stocks, with these 7 accounting for 55.2% of S&P 500 returns in September, owing to their high-quality business models and perceived resilience to potentially slowing economic conditions.
In early October, just as markets were reflecting upon the direction of economic travel, the very same labour market data investors were so vigilantly watching showed a pickup in job creation, pushing unemployment down and wage gains up. Markets turned, with only a 0.25% rate cut now expected in November versus 0.5% previously, and government bond yields moving upwards in unison. Within equity markets there was a renewed rally in cyclical industries like industrials and financials.
Where to from here? Markets have begun to increase their probabilities of market volatility following the presidential election on November 5th, with the Federal Reserve meeting the following day to choose interest rate policy (0.25% cut expected). All eyes will be on the results of the election and Fed policy.
Fed rate cuts have also been supportive of asset markets globally, in particular with increased dollar liquidity spilling into emerging markets, allowing Chinese authorities to bring forward stimulus measures without putting undue depreciation pressure on the Yuan.
Chinese Stimulus
That brings us to the other main story in markets: Chinese stimulus. As mentioned, China had been waiting for the US monetary policy easing to provide large stimulus measures, with the People’s Bank of China (PBOC) Governor Pan Gongsheng previously emphasising currency stability in messages over the summer. With that US roadblock out of the way, China has announced their first large round of fiscal and monetary supports, summarised as follows:
1. Monetary Policy
a. Cut in central bank base rates by 0.2%.
b. Cut in commercial bank reserve requirements, releasing $160bn in new credit.
2. Property Market Policy
a. Cut in mortgage rate by 0.5%.
b. Cut in down-payment requirement.
3. Stock Market Support
a. $80bn central bank borrowing facility for brokers, dealers and funds to fund stock purchases.
b. $50bn central bank borrowing facility for companies to fund share repurchases.
4. Household Consumption Support
a. Continued funding for household goods & automotive trade-in schemes (cash-for-clunkers).
b. Initial pilots of cash-handouts to the deeply impoverished.
So, what’s the assessment of all this? Given the total value of support is around 1.6% of GDP this stimulus is substantial, but not as significant as the huge 30% of GDP credit stimulus seen in the post-financial crisis 2008-9 period.
Points 1 and 2 are unlikely to move the needle, having been tried last year to little effect – the demand for credit, both by households for property and businesses for capacity expansion, is fairly subdued, so falling interest rates may have little impact on credit growth.
Point 3, on the other hand, is already having an impact. This has increased investor confidence in Chinese domiciled assets and those assets that are most correlated with rising wealth and economic activity in China; Chinese equities have skyrocketed, gaining 25% in two weeks, while commodities and emerging market equities have rallied. The “ripple effect” has seen the Asia-focused UK bank Standard Chartered rally by over 9% and European luxury goods group LVMH rise over 8%. It should be noted that these improvements in market liquidity and investor confidence lay relatively brittle foundations for this rally that will need stiffening with improvements in corporate and economic fundamentals.
Point 4, while a good start, is just too small to effectively redress the structural imbalance at the heart of China’s economy – of weak domestic consumer demand, owing to a low household share of national income, and the subsequent need for high rates of questionable Government funded property & infrastructure investment to prop-up otherwise weak demand in the economy. Further announcements are scheduled in the coming weeks of additional fiscal measures, expected to be targeted at households, which hopefully will start to enact rebalancing. Unfortunately, without a comprehensive set of such reforms, rallies in China’s equity market are unlikely to turn into long-term positive trends, as businesses continue to deal with the pressures of a deflationary economy.
Conclusion
In summary, asset markets have been supported by increasingly supportive policy in both China and the US, with China enacting wide ranging, but fairly shallow, stimulus and the US Fed starting their interest rate cutting cycle with a bang.
Markets have been buoyed by this increase in liquidity and investor confidence, however questions remain over the effectiveness of Chinese stimulus and the medium-term health of the American labour market. In the shorter term, politics is likely to be a driver of market volatility. Investors are therefore advised to allocate to diversified portfolios and maintain their nerve through short-term rough patches in the pursuit of long-term returns.
Please contact your advisor if you have any questions.
Arrange your free initial consultation
The information in this article is correct as at 11/10/2024.
This market update is for general information only, does not constitute individual advice and should not be used to inform financial decisions. Investment returns are not guaranteed, and you may get back less than originally invested; past performance is not a guide to future returns.

Market Horizon: Smooth Sailing or Rough Waters?
In last month’s TPO Investment Market Update we spoke about the market volatility seen in early August, caused by a sharp decrease in risk taking due to the combination of:
-
An abrupt change to Japanese monetary policy,
-
The release of weak US labour market data, and
-
Concerns over the ability of large tech firms to turn AI investments into bottom-line profits.
Arrange your free initial consultation
Since then, global equity markets have broadly recovered, although worries remain over both the health of the US labour market going forward and the ability of the largest technology companies to deliver on the promised profits of their AI investments. These worries have resulted in a minor selloff of tech stocks at the start of September, flattening global equity returns.
For September’s investment market update we will take a closer look at the recovery in markets and the previously mentioned factors causing ongoing concern amongst investors.
Market Recovery
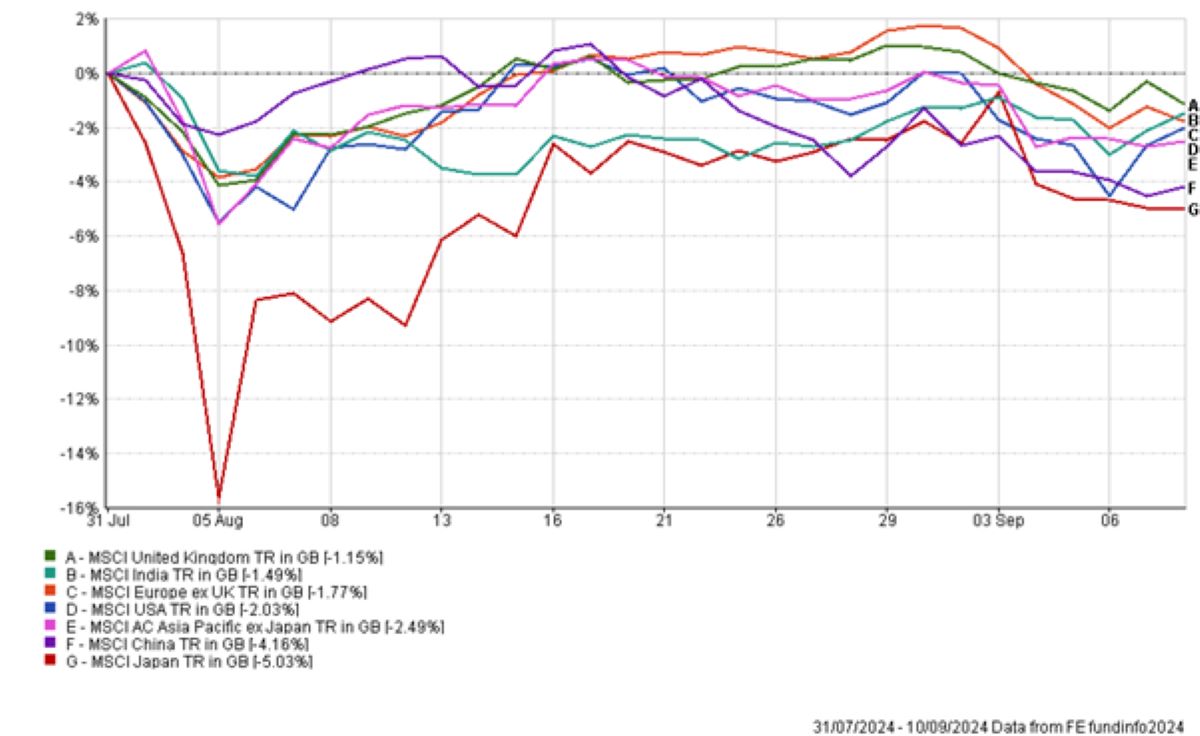 Figure 1 – Returns of major regional equity indices from August to early September – Source: FE Analytics, 2024.
Figure 1 shows the returns of major regional equity markets to a sterling denominated investor from August through to early September. The major bout of volatility, hitting Japanese equities the hardest, can be seen in the first week of August – for an explanation of the factors causing this please read last month’s market update, available here. Markets recovered through August, as investors came to the conclusion that the moves in early August were an overreaction. Market volatility reduced and the hardest hit regional markets and sectors/industries saw the swiftest recovery. This meant a strong rebound in Japanese equities and large technology companies.
The beginning of another, hopefully smaller, selloff
What we also see in Figure 1 is the beginnings of another selloff in equity markets at the start of September. While this has not been nearly as violent as the August selloff, it has nonetheless pulled many regional indices down close to their levels seen in August. The background causes remain similar to last time, excluding the Japanese monetary policy factor – primarily concerns over a weakening US labour market and the high stock prices of US tech firms relative to the profits they are currently delivering from their AI investments.
So, what are the US labour market concerns? These concerns stem from slowing job creation and a rising unemployment rate. The most recent market-moving data releases were the reports on job openings and new job creation, both of which are down significantly versus a year ago, or even a few months ago. Whilst neither measure is at the level indicating a recession, the direction of travel indicates a slowing economy. You can be fairly sure a recession is signposted when total employment declines outright from month-to-month. The most recent data showed 142,000 jobs added in August 2024, so no recession, but down significantly from the 210,000 jobs added in August of 2023 and below the roughly 200,000 jobs needed to keep up with population growth.
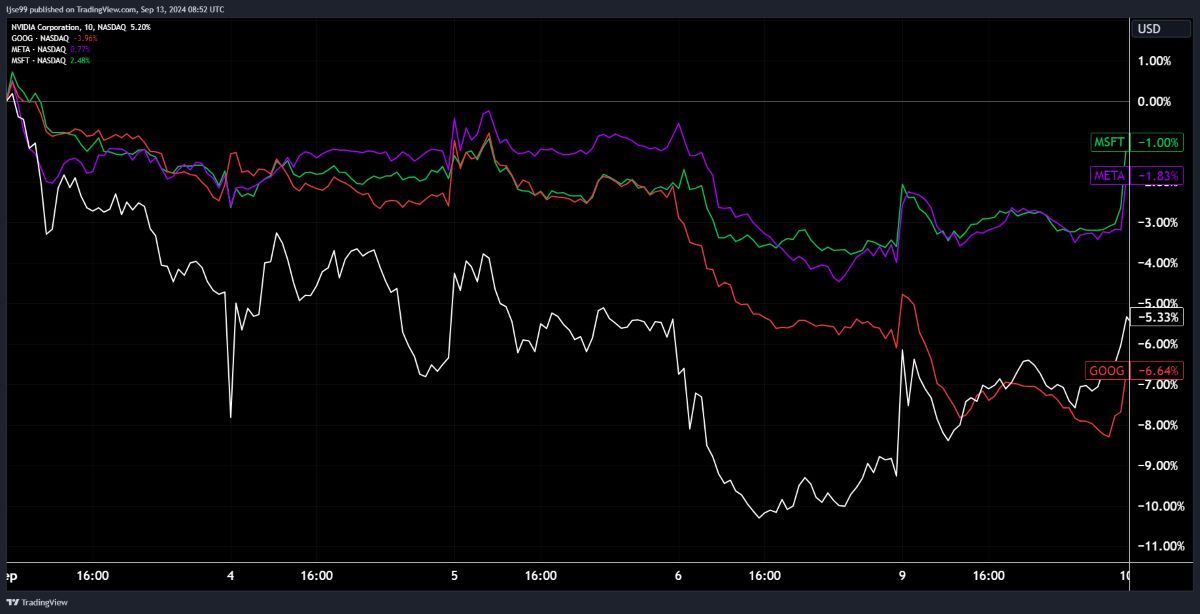
Figure 2 shows the returns of the most prominent AI-related technology companies in early September. Nvidia, the most linked to AI, fell as much as 11% by 06/09/24 but has since recovered around 6% of that drop. Similarly, Google (Alphabet) is down over 7% so far this month.
But what has caused this selloff? Outside of the general risk-averse sentiment caused by weakening labour market data, investors are becoming increasingly sceptical of tech firms ability to turn their large AI investments into near-term profits. Whilst AI models like ChatGPT have wowed us with their innovation, they have not yet found sufficient commercial uses to generate revenues that cover the costs of building out vast data centres and research teams. Despite this, tech firms steam ahead, with Mark Zuckerberg commenting in a recent interview that they must continue to invest heavily in AI for fear of falling behind others and becoming ‘irrelevant’ in years to come.
This sentiment came to a head upon the release on Nvidia’s most recent quarterly earnings report, along with the forward guidance for the next quarter that comes with it. While Nvidia recorded substantial revenue growth from the first to the second quarter, growing in one quarter what the average company would be envious of growing in a whole year, their forward guidance pointed to slowing revenue growth in coming quarters. They cited issues with the production of their next generation Blackwell chips. While revenues are expected to continue growing, the expectation of just a slowing of that rate of growth rattled markets because of the very steep growth assumption baked into Nvidia’s high share price. Markets have reacted to this and applied the sentiment to other AI-related stocks, along with research suggesting Microsoft may only be bringing in profits in the single digit billions from their ownership of OpenAI (the creator of ChatGPT), a drop in the bucket for a firm generating profits of $72bn in 2023. AI-related stocks have therefore seen the price declines shown in Figure 2.
What next?
Given the importance that markets have recently attached to US labour market data, the next month’s figures will be pivotal to market narratives, meaning another month of weak job growth will confirm a slowdown and could lead to further equity market volatility. Conversely, more positive figures should push investors back to the ‘soft landing’ camp.
Additionally, politics will continue to be an important factor. Kier Starmer’s first Budget will be unveiled on October 30th and the US election will take place 6 days later on November 5th. While the former is unlikely to surprise capital markets – save for some speculation about removal of the inheritance tax breaks given to investors in the London AIM equity market – there is far more uncertainty surrounding the latter, with neither US presidential candidate having fully fleshed out their economic policies, leaving a wide range of policy uncertainty for investors to navigate.
Given the potential for political uncertainty and volatility ahead, we recommend a portfolio that is spread across regions, as well keeping a patient approach to remain invested through volatile periods.
If you have any questions about navigating such an environment, please don’t hesitate to contact your adviser.
Arrange your free initial consultation
The information in this article is correct as at 12/09/2024.
This market update is for general information only, does not constitute individual advice and should not be used to inform financial decisions. Investment returns are not guaranteed, and you may get back less than originally invested; past performance is not a guide to future returns.

How the 'painful' Budget might damage your finances?
What does Rachel Reeves’ first budget have in store for your finances, and what action should you take now to protect against the possible changes?
When Keir Starmer stood in the garden of Downing Street on 27 August, he spoke of ‘Fixing the Foundations’ of the country and of a ‘£22 billion black hole in public finances’. This has led commentators to conclude that if tax rises weren’t planned in Rachel Reeves’ first budget before, they certainly will be now.
When is the Autumn Budget?
The Autumn Budget will take place on 30th October 2024.
Arrange your free initial consultation
What is likely to be in the Autumn Budget?
When Labour ran for election, they ruled out raising taxes on ‘working people’ and specifically pledged not to increase Income Tax, National Insurance, VAT or Corporation Tax. This potentially limits the taxes they can look at (though we would expect Income Tax thresholds to remain frozen until 2028 as announced by the previous government) and we have summarised our views on these various taxes below:
Pensions
Though this would technically be a change to income tax, one possibility for the Government would be to reduce tax relief on pension contributions for high earners. We already have the pensions’ ‘annual allowance’; which limits pension contributions for very high earners, but there is currently the opportunity for those paying higher rates of income tax, but with overall income below the threshold required to have a tapered ‘annual allowance’, to benefit from significant tax relief and the Government could look to limit this.
Another potential change to pensions is reviewing their beneficial tax treatment upon death, where they fall outside the individual’s estate for inheritance tax purposes and can be passed to future generations at attractive rates of tax. Though taking action in the anticipation of potential future legislation changes would be inadvisable, if changes to pension death benefits are announced in the budget, financial plans will need to be reassessed.
Finally, the 25% tax free lump sum available from pensions has been talked about as an ‘at risk’ benefit for years, but it would certainly be viewed as unfair if this was targeted now, given that people have been saving towards retirement expecting to benefit from this. Additionally, changes to the ‘Lump Sum Allowance’ have only just come into force in the current tax year and the Government has already said it will not be reintroducing the Pensions’ Lifetime Allowance, so they may be reluctant to tamper with this area further.
Capital Gains Tax (CGT)
With capital gains above the £3,000 annual exemption taxed at just 10% for basic rate tax payers and 20% for higher rate tax payers (higher rates apply for second property sales), there are rumours that the Government will review CGT rates.
However, HMRC’s own projections indicate equalising capital gains tax and income tax rates could actually reduce the Government’s overall tax take, given this would discourage individuals from selling assets (and crystallising gains) so they may instead decide to retain them.
Additionally, it should be noted that cost prices for capital gains tax purposes are currently rebased on death (meaning gains essentially die with the individual) and if this was changed, financial plans would need to be revisited.
Inheritance Tax (IHT)
With the UK inheritance tax rate currently 40%, it is somewhat surprising that the tax only raises c. £7bn p.a. (of a total tax take of c. £1trillion in 23/24). The reasons for this are the various reliefs available, including:
The ability to gift unlimited amounts to individuals with, broadly speaking, no tax consequences if the donor lives seven years following the gift).
The ability for couples to pass up to £1m between them tax free to direct descendants upon death.
The Government could look to limit some of these reliefs and with £1 trillion of wealth expected to change hands in the UK in the 2020s alone, according to the Financial Times, the Government could see this as an area to focus on.
How will the Autumn Budget affect me?
We of course do not know what changes will be announced in the Autumn Budget on 30th October and, crucially, from when they take effect.
So, what can you do to protect your wealth?
This means there may or may not be time to take action following the budget, and while we would discourage taking action on the basis of rumours, there are actions that can be taken before the budget to take advantage of reliefs that are available now but could be at risk post 30 October.
To speak to an Independent Financial Adviser about how the Autumn Budget might affect you and any actions you could consider ahead of the budget, please contact us for a free initial consultation.
Arrange your free initial consultation
The details in this article are for information only and do not constitute individual advice.
The Financial Conduct Authority (FCA) does not regulate estate planning, tax or trust advice.
The information contained within this article is based on our understanding of legislation, whether proposed or in force, and market practice at the time of writing. Levels, bases and reliefs from taxation may be subject to change.
The value of your investments can go down as well as up, so you could get back less than you invested. Past performance is not a reliable indicator of future performance.
A pension is a long-term investment not normally accessible until age 55 (57 from April 2028 unless the plan has a protected pension age). The value of your investments (and any income from them) can go down as well as up which would have an impact on the level of pension benefits available. Your pension income could also be affected by the interest rates at the time you take your benefits.

Pensions vs Property - which is best?
A popular question often asked by clients is whether they should contribute into a pension or invest in a property portfolio to fund their retirement.
The reality is there are pros and cons for each investment vehicle, so it’s important to look at these along with how returns compare over the last 10 years. Here we break these down so you can better understand which option may be better suited for you. Although we would always recommend speaking to a financial expert before embarking on your decision.
Arrange your free initial consultation
Pension
Advantages
- Personal pension contributions attract income tax relief at your marginal rate. This means for basic-rate taxpayers, a £1 contribution essentially costs you 80p, as 20% tax relief is provided by the Government under the ‘relief at source method’. Your contributions can also help you reclaim certain tax allowances, such as the personal allowance, tax-free childcare, and child benefit entitlement. If you’re a higher rate taxpayer, you can claim an additional 20% or even 25% tax relief for an additional rate taxpayer.
- Employer pension contributions are essentially ‘free money’ as your employer is providing this as an additional benefit in your remuneration package – often if you don’t take up the contributions, they won’t provide an alternative income instead. Business owners can reduce their Corporation Tax liability by making contributions into their own name.
- Any investment growth is free of Income Tax and Capital Gains Tax.
- Usually, 25% of the value can be withdrawn tax-free in retirement.
- Ability to invest in a diversified range of asset classes (cash, fixed interest, shares, property, and other instruments). Further diversification can be achieved by diversifying assets geographically.
- Flexibility to draw an income in retirement through various methods such as a Lifetime Annuity, Fixed-Term Annuity, and Flexi-Access Drawdown.
- If structured appropriately, any remaining funds after your death can sit outside of your estate for Inheritance Tax (IHT) purposes. This can be a tax-efficient way of passing wealth on between different generations.
Disadvantages
- You are unable to access your pension funds until age 55. This will be increased to age 57 from 6 April 2028.
- The value of your pension is subject to investment risk.
- Depending on how much you spend and how long you live for, your pension pot could be exhausted during retirement if not managed appropriately.
- Legislation can be complex, and rules are often changed.
- On-going charges will apply (pension provider/platform, investment related charges and financial adviser fees).
Property
Advantages
- Potential for long-term capital appreciation and an opportunity of outperforming inflation over the long-term.
- Potential for a regular rental income stream. This can provide a consistent cashflow which can be reinvested into property or other assets.
- A diversifying asset as part of an overall investment portfolio, which means that it can provide a hedge against market volatility.
- Property improvements can add to the value and/or increase rental yields.
- Physical asset and you own something tangible.
- 20% tax-credit available on mortgage interest.
Disadvantages
- If capital is required, it can often be a lengthy process to release equity.
- High initial costs (legal fees and stamp duty etc). A surcharge of 3% on top of normal stamp duty rates applies on purchase of an additional property.
- Potential debt if you require a mortgage to fund the purchase.
- Property management. This can be a hassle, stressful, and time consuming. Paying a professional will eat into your rental yield.
- Maintenance – any repairs will need to be carried out swiftly and the costs are funded by you.
- Potential void periods. This can be a tricky situation to find yourself in if you have a buy-to-let mortgage.
- Tax credit on mortgage interest restricted to 20%, even if you are a higher-rate or additional-rate taxpayer.
- Capital Gains Tax will be applied on any profit when sold.
- Included as part of your estate for IHT if held until you pass.
Pension vs Property Performance
A common issue UK property investors face is that the value of their portfolio is influenced by the UK economy and sentiment.
Investing through a pension can be a much simpler way to diversify globally and across different asset classes through a basket of funds. This can help smooth out governmental decisions or country specific issues, and benefit from growth in other economies.
Past performance is not a reliable indicator of future performance.
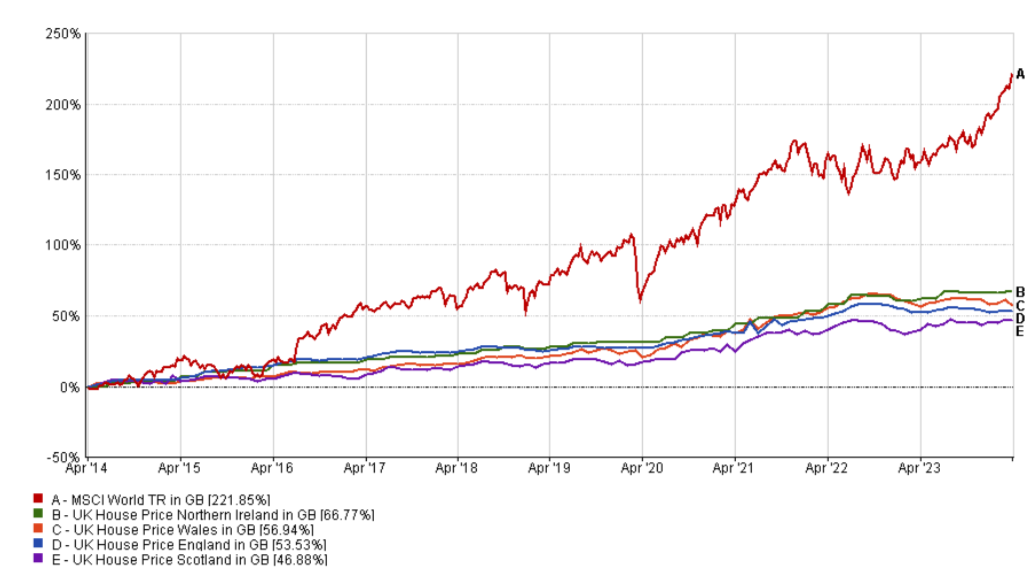
Figure 1: Stock market performance VS Property - Source: FE Analytics, 2024.
The chart above demonstrates the stock market has outperformed UK property over a 10-year period.
The MSCI World Index measures the performance of equity markets across developed countries and has returned 221.85% over this period. UK property returns range between 46.88% - 66.77%.
However, it is important to note these property returns are based on capital appreciation only and do not include any rental incomes received. According to NatWest, as of 2024, the average annual UK rental yield is between 5% and 8% gross.
Should I invest in property or a pension?
Both investment vehicles provide different advantages and disadvantages, as detailed above, and each have a place within a diversified portfolio. As each of our personal circumstances can vary widely, is important to seek advice. An independent financial planner will be able to help you establish which solution is most suitable for your own personal needs. If you’d like to speak to one of our expert advisers, why not get in touch for a free initial consultation, to see if we can help.
Arrange your free initial consultation
This article is intended for general information only, it does not constitute individual advice and should not be used to inform financial decisions.
The Financial Conduct Authority (FCA) does not regulate estate planning, tax advice or most types of buy-to-let mortgages.
Your property may be repossessed if you do not keep up repayments on your mortgage.
Investment returns are not guaranteed, and you may get back less than you originally invested.
A pension is a long-term investment not normally accessible until age 55 (57 from April 2028 unless the plan has a protected pension age). The value of your investments (and any income from them) can go down as well as up which would have an impact on the level of pension benefits available. Your pension income could also be affected by the interest rates at the time you take your benefits.
The information contained within this article is based on our understanding of legislation, whether proposed or in force, and market practice at the time of writing. Levels, bases and reliefs from taxation may be subject to change.

New ‘British ISA’ Cancelled
The UK government has scrapped plans for a ‘British ISA’ over concerns that it would “complicate” the investment market for individuals.
The planned British ISA would have channelled savers’ cash into London-listed stocks, in a bid to boost both savings and the economy.
Sources said that Labour had abandoned plans to push ahead with the new Individual Savings Account (ISA) product drawn up by the last Conservative government, which would have allowed an extra £5,000 tax-free allowance when investing in UK companies or equities.
Before the general election, Labour had “no plans to drop the British ISA”, but now it appears that this plan has changed.
The planned British ISA
The previous government proposed the new product earlier this year, in the March budget, in an effort to encourage savers to invest and support UK stocks, which have seen a decline as investors have shifted towards global shares in recent years. The British ISA would have offered an extra tax-free, allowance, on top of the existing £20,000 annual limit.
Jeremy Hunt, then Tory Chancellor, said in his March Budget that it would ensure savers “benefit from the growth of the most promising UK businesses”.
Although the current government has decided to drop plans for the British ISA, Chancellor Rachel Reeves has set out a blueprint that could support UK equities by funnelling more defined contribution pension money into a wider range of UK assets, which, although positive, does nothing to take the sting away for everyday savers that would have benefited from the new ISA with its larger allowance.
What is an ISA?
An ISA, or ‘Individual Savings Account’, is essentially a savings account that you don’t pay tax on. Cash ISAs simply allow people to save money without incurring income tax on interest, while Stocks-and-Shares ISAs shelter investors from income tax on dividends and capital gains tax when selling shares. There are several different versions, including the Lifetime ISA and the Innovative ISA.
You can save up to £20,000 each tax year into one or a combination of ISAs and receive tax-free returns, so when the value of your ISA increases, you get to keep all of it tax-free*.
When choosing a style of investment to suit your needs, you may want to consider how long you plan to invest for and how much you would like your money to grow. It is also important to understand what movement in value you may or may not be happy with and any potential losses that may happen. That is why seeking professional advice can be crucial for understanding how to take those first steps towards a secure financial future.
If you want to find out more, why not give us a call on 0333 323 9065 or book a free non-committal initial consultation with one of our chartered advisers to see how we can help.
Source: Gov.uk
Arrange your free initial consultation
The details in this article are for information only and do not constitute individual advice.
Investment returns are not guaranteed, and you may get back less than you originally invested.

Global Markets on Edge: Dissecting the Recent Selloff
August has started with some volatility in investment markets with a number of causes and effects which we will go into in this update, along with some forward-looking discussion. Hopefully this is informative and places the current moves into a wider context. As always, we stress that the recent activity reinforces the need for a portfolio that is diversified across geographies, economic sectors and asset classes, and that risk portfolios should be viewed as long term to reduce the impact of volatility.
Arrange your free initial consultation
Starting with the macroeconomic context, inflation had been steadily falling through the year and there were initial signs of the economy cooling, although the speed/magnitude of the economic slowdown was not clear. Prices are set by the relative match between demand and supply, meaning falling inflation can reflect rising supply or falling demand - markets had been increasingly leaning towards falling demand as the main cause, especially as retail sales numbers began to falter and consumers increasingly found it harder to obtain credit. The labour market looked like it was becoming more balanced, with wage growth slowing and vacancies falling, but the fear was that this process would continue, leading to excessive unemployment and a rapid slowdown in economic growth.
In markets, the context was of overstretched technology valuations resulting from a small number of tech firms driving the bulk of market returns over the last couple of years, as well as very low levels of volatility. While markets frequently display momentum characteristics in which existing trends amplify themselves, in this case tech outperformance and low volatility begetting further tech outperformance and lower volatility, they also eventually correct themselves. The painful element is the rapidity of that snap-back to reality. Over the last few weeks investors started to question the ability of tech firms to drive near-term profitability from their enormous capital investment in AI models and infrastructure, bringing this correction event closer into view.
A final markets context was the extent of the Yen “carry trade”, in which investors from around the world borrowed at low rates in Japan to buy higher yielding/returning risky assets abroad. The scale of this trade is disputed, but numbers as high as $2tn or even $4tn have been proposed. When volatility is low and Japanese interest rates remain pinned to the floor this trade can pay off handsomely, however a rise in Japanese interest rates and rapid strengthening of the Japanese Yen can throw this trade off and cause investors to sell the risk assets they bought using borrowed Yen.
The crowded ‘long-technology vs short-small cap’ trade starts to unwind
A very popular trade, particularly for large institutional investors, has been to go long US tech balanced against a short position in US small caps. This means buying US tech paired against selling of US small caps. This trade is usually implemented with significant leverage to boost returns. US tech has seen strong earnings growth while small caps have been squeezed particularly hard by high interest rates, leading to outperformance of US tech, rewarding those in this trade.
As investors became increasingly worried about economic growth in mid-July there was a deleveraging (selling down) of this position. Institutional investors often use leverage for both the long and short side of the trade, so as they cut their overall leverage, they are forced to buy back the stocks they are short and sell the stocks they are long. This meant buying small caps and selling tech. You see this in the returns below, in which small cap (white) rallied and tech (orange) sank from July 11th to 31st:
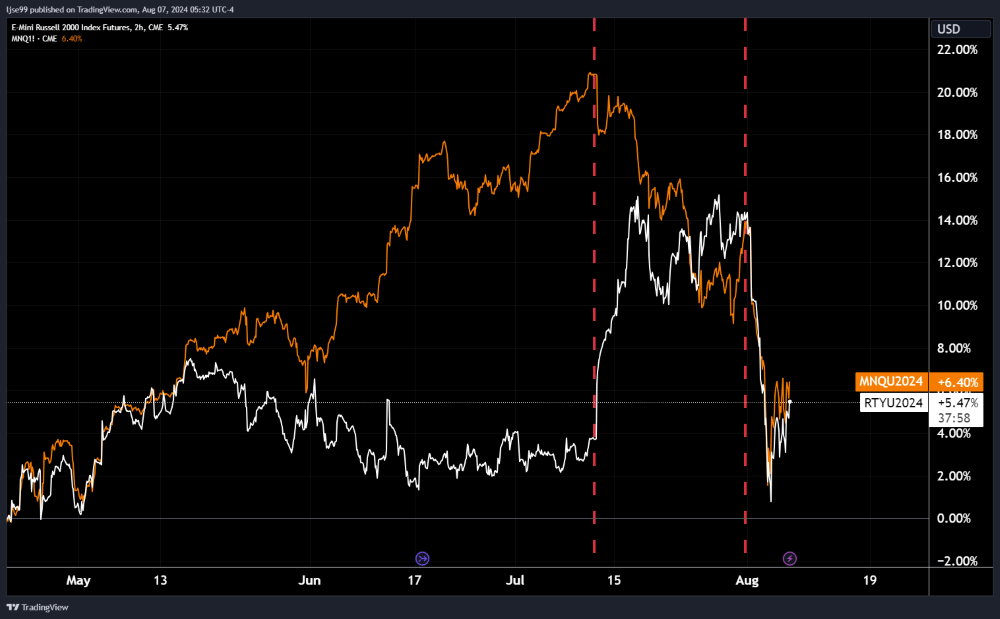 Figure 1 – NASDAQ Index (orange) and Russell 2000 Index (white) returns – Source: TradingView 2024
Japan raises rates, unwinding the “carry trade”
Japan has maintained unusually low interest rates relative to peers in an attempt to spur economic activity and introduce a moderate level of inflation to their long-deflating economy. An unfortunate side-effect has been significant currency weakness.
For those borrowing in Yen to buy foreign assets (the “carry trade”) a weaker Yen is beneficial, as it effectively cuts the cost of your borrowings relative to the value of the foreign asset you have bought – for example, if your borrowed 100 Yen to buy $100 of US assets at a 1:1 rate, but then Yen devalues such that $1 now gets you 2 Yen, you could sell just half of your $100 of assets to fully pay back your 100 Yen borrowings, leaving you in $50 profit. However, that same process works in reverse when the Yen strengthens, potentially pushing the investor to have to sell up their foreign assets to pay back their Yen borrowings.
Last week saw Japanese labour market data released showing a ~5% rise in wages for unionised workers, leading the Bank of Japan to conclude that there was a risk of inflation pushing beyond the moderate levels they targeted and becoming similar to the issues seen in Europe in 2022/3.As a result, they chose to raise interest rates by 0.15%. While the raise itself was small, the signal to markets was large and caused Japanese bond yields to rise in expectation of further rate hikes.
The Japanese Yen then rallied hard, shown in the chart below:
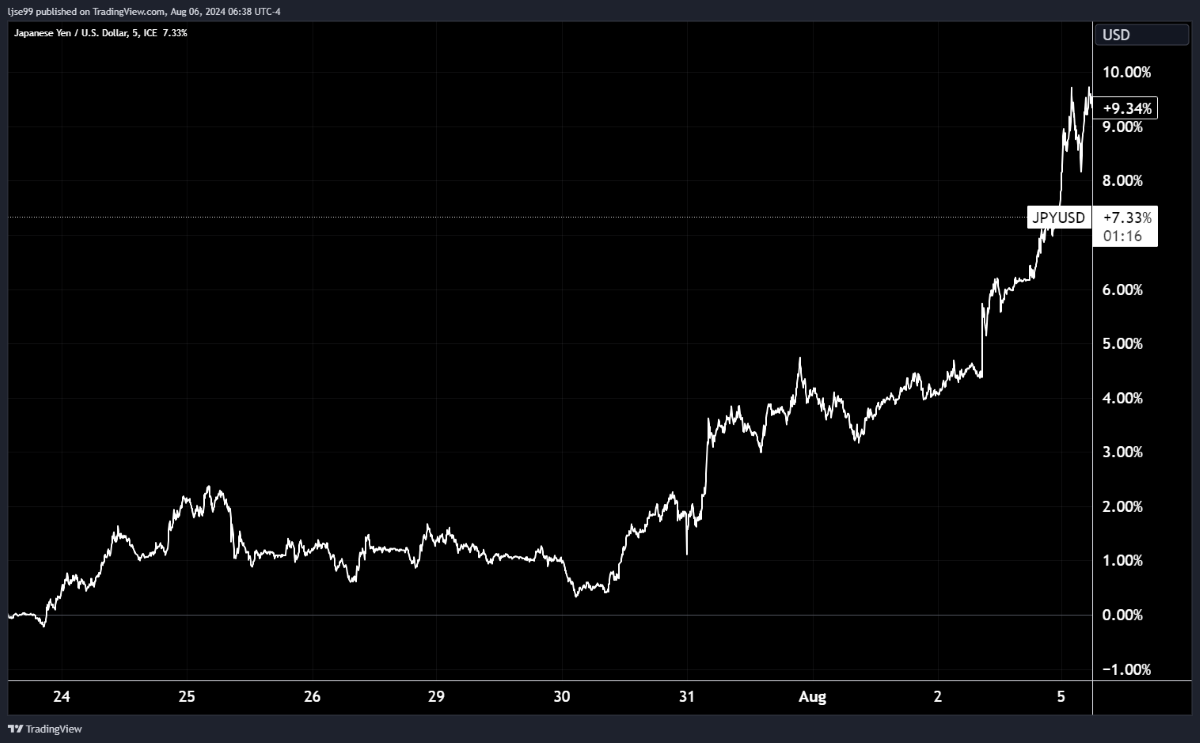 Figure 2 - Japanese Yen versus US Dollar - Source: TradingView, 2024.
Many investors were therefore forced to sell their foreign risk-assets to pay back their Yen borrowings.
Israel-Iran tension rise, increasing geopolitical risk
Although this is not the primary driver, it certainly has contributed to the overall risk-off attitude. Rising tensions in the middle east following Israel’s assassination of Hamas leadership on Iranian soil, along with further Israeli attacks in Syria and Lebanon, led Iran to threaten retaliation and an escalation in tensions. Oil prices jumped and geopolitically sensitive assets dropped, indicating a rise in geopolitical risk premium.
US labour market data indicates the beginning of a recession
Before anything else, it should be stressed that for a recession to be unequivocally marked there needs to be decline in the following 4 indicators: industrial production, personal incomes, employment and retail sales volumes. Friday’s employment data points to the start of employment problems, so is not the official start of a recession, however if those trends in employment persist it can be expected that the other three components also deteriorate.
What was the data? The US economy added 114,000 jobs in July, below the roughly 200,000 jobs needed to keep up with population growth. This meant that unemployment rose sharply from 4.1% to 4.3% in July, up from 3.4% in April 2023.
Historically the US unemployment rate has never risen 1% without a recession occurring shortly afterwards. A similar concept, the Sahm rule, was also triggered, which states that a recession is entered when the 3-month average of unemployment is 0.5% above the minimum unemployment rate of the previous 12-months. Please see the Sahm rule chart below.
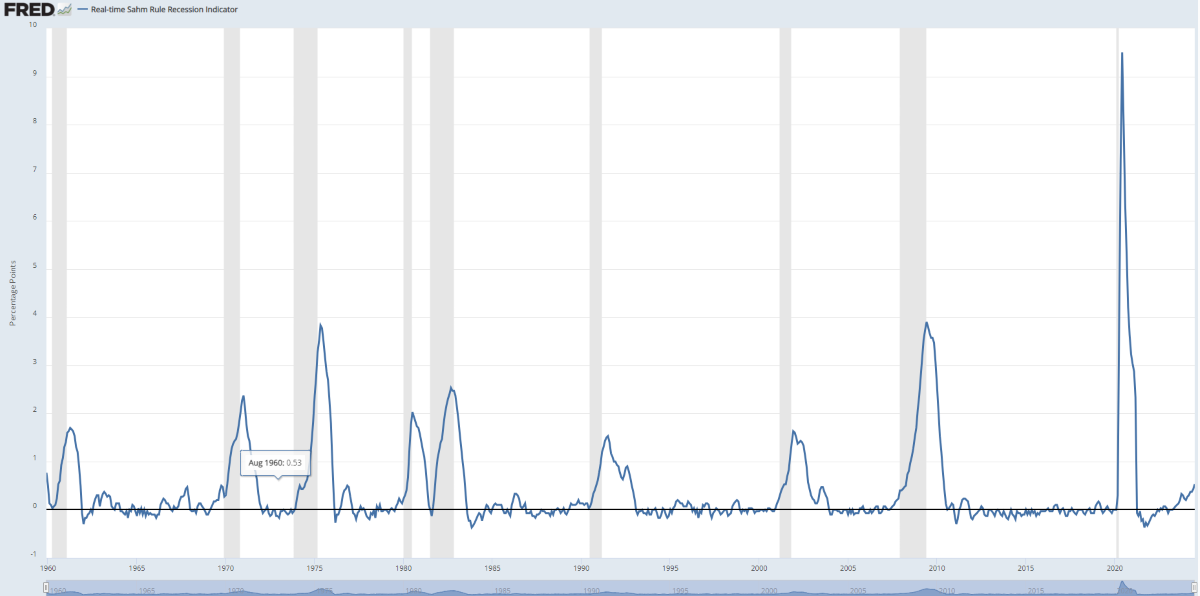 Figure 3 – Sahm Rule, with US recessions shaded – Source: Federal Reserve Bank of St Louis, 2024.
With investors now firmly in the recessionary camp, equity selling became rather indiscriminate, with few names remaining unscathed. Our next section will cover the market moves.
Market moves
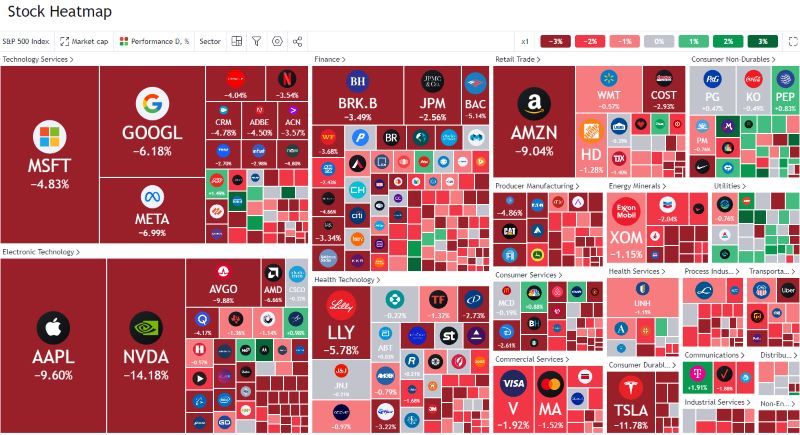 Figure 4 – US stock market heatmap at the US market open 05/08/24 - Source: TradingView, 2024.
Starting with equity markets, the heatmap above shows US equity sectors as US markets opened on Monday. Defensive sectors like consumer staples (labelled consumer durables) and utilities saw positive performance, while most other sectors have seen rapid declines. Notably, many of the most overvalued technology names saw the most rapid price declines. Through the trading day equities subsequently rebounded and regained much of the value they lost. Although equities rebounded, volatility is high, with the VIX volatility index hitting 49 intraday and settling closer to 30; 49 is a level last seen during the 2020 COVID crash:
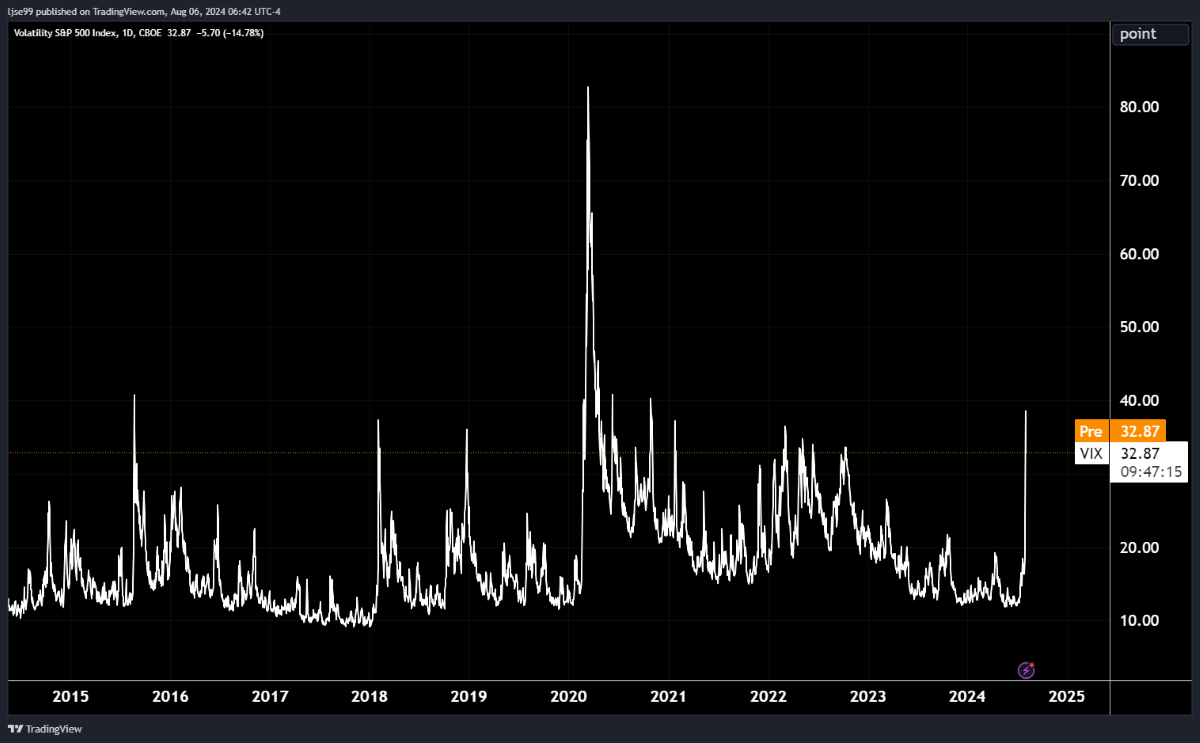 Figure 5 – VIX Volatility Index – Source: TradingView, 2024.
On a country level selling was fairly indiscriminate, and Japan, which is at the centre of the carry trade, was hit hardest:
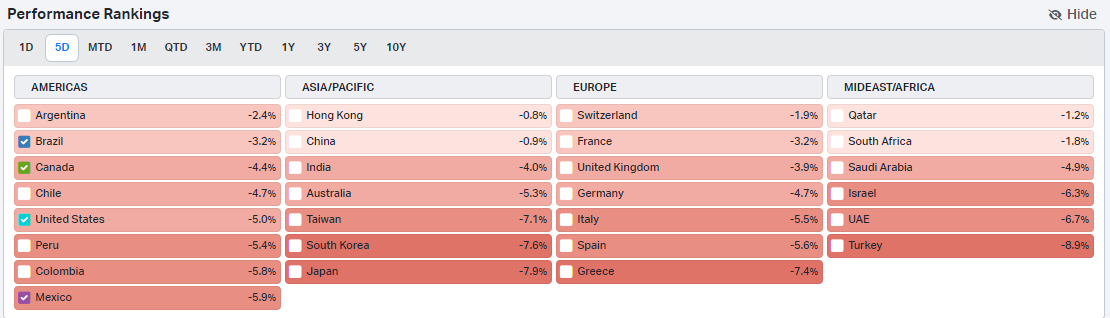 Figure 6 – National stock market returns 05/08/2024 - Source: Koyfin, 2024.
In the following hours, particularly the second half of the US trading session, Japanese equities also rebounded and made up around half of their losses.
In terms of currencies, there has been a strong safe-haven effect, as investors pull money home, or crowd into currencies perceived as safe havens. Unsurprisingly the Japanese Yen has rallied hard as the increase in Japanese interest rates has made it more attractive, continuing the strength that originally unwound the carry trade. The Swiss Franc, a typical safe-haven, has rallied. The Euro has seen repatriation flows from nervous European investors. All are typical signs of risk-off mentality.
Finally, moving to bonds and fixed income where the safe-haven effect has also been very apparent. Investors crowded into safe government bonds, betting on imminent emergency rate cuts (more on this below). High yield credit sold off, as investors bet on slowing growth causing increased corporate bankruptcies.
The rapidity of this recent move in fixed income yields is quite extraordinary and is well characterised in the following graph, showing US 2-year yields in white and US 10-year yields in orange:
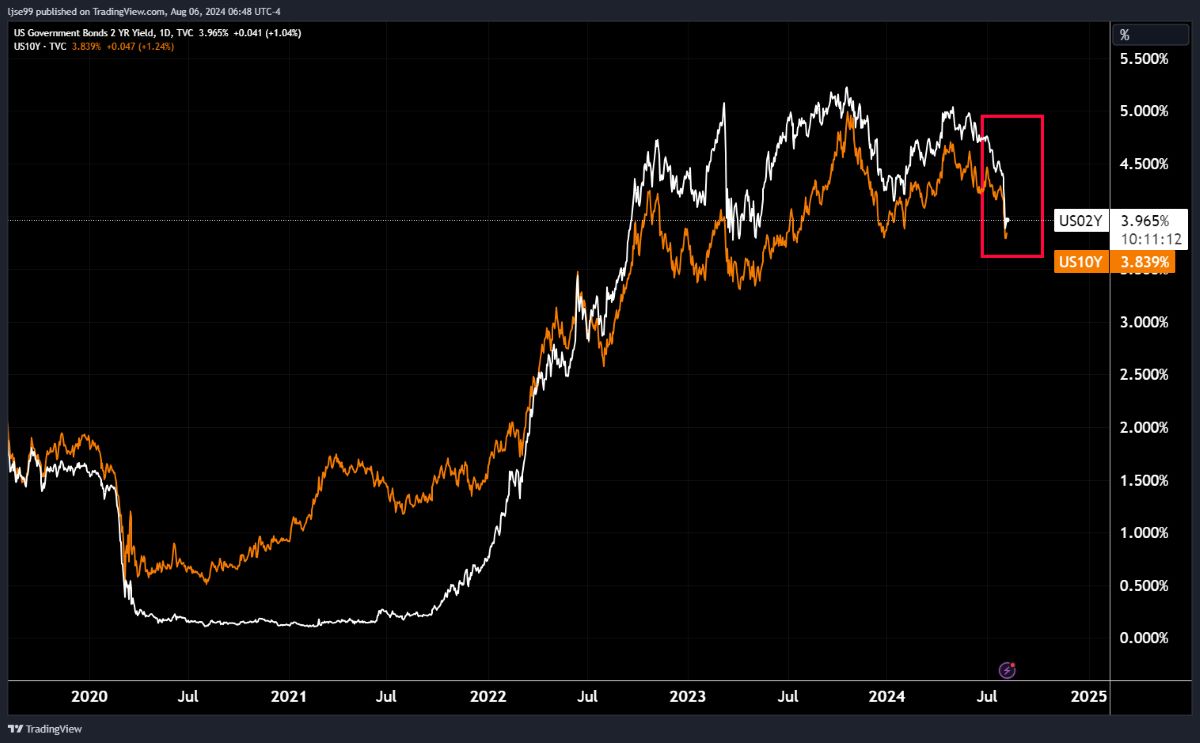 Figure 7 – US 10-year (orange) and 2-year (white) yields – Source: TradingView, 2024.
Yields declined -0.5% in the space of hours– you would normally expect to only see moves this large once every 10 years. Bond yields gyrated rapidly through the day, with the US 2-year yield subsequently gaining 0.3%, leaving the net daily change in yields close to –0.2%.
Where do we go from here?
The Federal Reserve just had a Federal Open Market Committee (FOMC) meeting in which they chose to keep rates on hold, in contrast to the Bank of England who cut rates. Markets are now assigning a 16% probability to an emergency rate cut in the next two weeks. Beyond that, they are also predicting a double rate cut at the September FOMC meeting, 5 rate cuts by the end of 2024, and 7 cuts by March of 2025. If markets are correct, that would leave interest rates below 4% for the first time since December 2022.
While this will certainly bring hope to investors in government bonds, as mechanically they will have to appreciate in value as interest rates fall, the outlook for risk assets is more sanguine. History has shown that Central Banks cut interest rates just as an economy enters recession and do not prevent recession (although they may shorten it), and risk assets typically fall in the 6-24 months following the implementation of a cutting cycle – it took until March of 2009 for equities to bottom out, yet rates were first cut in August of 2007, meaning nearly 2 full years of declines. That said, circumstances are very different now compared with 2008. Banks are much stronger and better regulated so a credit crunch is unlikely. However, this could mean that we are possibly in for a bumpy ride in the near future.
Economies enter recessions when imbalances, whether in the financial system or real economy, become too extreme to paper-over and lead to outright ruptures. In 2007 the main imbalances were between booming sub-prime home lending and deteriorating borrower credit quality, along with extreme imbalances in commercial bank balance sheets. This blew up, but it laid the foundations for more sustainable growth from 2009 onwards that no longer relied on excessive buildup of household debts. Similarly, we now see enormous imbalances between the outcomes of large and small companies, in trading relations between the US and China, in demand and supply of commercial real estate, in US budget deficits versus economic growth. While a recession, if it happens, will be painful, it will also hopefully allow for future growth that is built upon more sustainable foundations. Additionally, from an investor perspective, will allow for enticing entry points into risk assets for those who are in their accumulation phase.
Let us hope, however, that this all turns out to just be a growth scare, rather than an actual recession.
There are ways to ensure that turbulent market environments do not have a significantly adverse impact on your invested wealth. Investing for the long term and picking appropriate risk mandates helps ensure that you will not need to draw on money that suffers greatly from short term volatility. At The Private Office we invest our clients wealth in portfolios which have been selected to benefit from long term growth in line with each individual’s needs and objectives. If you have any questions about your portfolio, please contact your adviser.
Arrange your free initial consultation
The information in this article is correct as at 07/08/2024.
This Market update is for general information only, does not constitute individual advice and should not be used to inform financial decisions. Investment returns are not guaranteed, and you may get back less than originally invested; past performance is not a guide to future returns.